Download

1 / 24
260 likes | 527 Vues
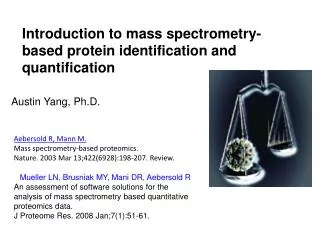
Introduction to mass spectrometry-based protein identification and quantification. Austin Yang, Ph.D. Aebersold R, Mann M. Mass spectrometry-based proteomics. Nature. 2003 Mar 13;422(6928):198-207. Review. Mueller LN, Brusniak MY, Mani DR, Aebersold R

E N D
Introduction to mass spectrometry-based protein identification and quantification Austin Yang, Ph.D. Aebersold R, Mann M. Mass spectrometry-based proteomics. Nature. 2003 Mar 13;422(6928):198-207. Review. Mueller LN, Brusniak MY, Mani DR, Aebersold R An assessment of software solutions for the analysis of mass spectrometry based quantitative proteomics data. J Proteome Res. 2008 Jan;7(1):51-61.
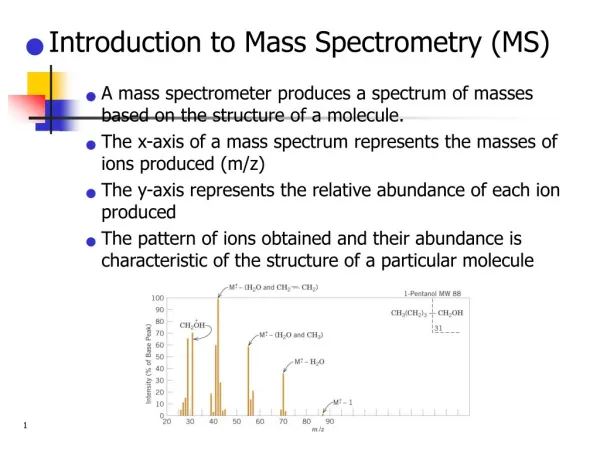
Monoistopic Mass = 1155.6 Average Mass = 1156.3 (calculated) As shown in Figure 1. the monoisotoptic mass of this compound is 1155.6. For a given compound the monoisotopic mass is the mass of the isotopic peak whose elemental composition is composed of the most abundant isotopes of those elements. The monoisotopic mass can be calculated using the atomic masses of the isotopes. The average mass is the weighted average of the isotopic masses weighted by the isotopic abundances. The average mass can be calculated using the atomic weights of the elements. www.ionsource.com
Electrospray Ionization (ESI) • Multiple charging • More charges for larger molecules • MW range > 150 kDa • Liquid introduction of analyte • Interface with liquid separation methods, e.g. liquid chromatography • Tandem mass spectrometry (MS/MS) for protein sequencing ESI MS high voltage highly charge droplets 20+ 19+ 18+ 21+ 17+ 16+ 22+ 15+ 14+ 500 700 900 1100 mass/charge (m/z)
Origin of the ES Spectra of Peptides m/z = (Mr+3H)/3 m/z = (Mr+H) 4+ 3+ 2+ 1+ H H H H H H H H H H m/z = (Mr+4H)/4 m/z = (Mr+2H)/2 ES-MS 2+ 3+ Rel. Inten. 1+ 4+ m/z
Theoretical CID of a Tryptic Peptide y1 y3 b1 y2 b2 b3 MS/MS Spectrum K G L F K F L G + + + + F L G K + + F L G K b3 y1 F L G K + + + + Parent ions F L G K F L G K CID b2 y2 + F L G K + + + + F L G K F L G K b1 y3 Non-dissociated Parent ions Daughter ions Relative Intensity m/z (464.29)
Web addresses of some representative internet resources for protein identification from mass spectrometry data
Data Mining through SEQUEST and PAULA • DatabaseSearch Time • Yeast ORFs (6,351 entries) 52 sec: 0.104 sec/s • Non-redundant protein (100k entries) 3500 min: • EST (100K entries, 3-frames) 5-10,000 min:
STEP 1. SEQ 1 SEQ 2 SEQ 3 SEQ 4 STEP 3. SEQUEST Algorithm Theoretical MS/MS spectra Step 1. Determine Parent Ion molecular mass Step 2. 500 peptides with masses closest to that of the parent ion are retrieved from a protein database. Computer generates a theoretical MS/MS Spectrum for each peptide sequence (SEQ1, 2, 3, 4, …) (Experimental MS/MS Spectrum) ZSA-charge assignment Step 4. Scores are ranked and Protein Identifications are made based on these cross correlation scores. Step 3. Experimental Spectrum is compared with each theoretical spectra and correlation scores are assigned. (Experimental MS/MS Spectrum) Unified Scoring Function
Amplification of False Positive Error Rate from Peptide to Protein Level + Prot A Peptide 1 in the sample (enriched for ‘multi-hit’ proteins) Peptide 2 Prot B + Peptide 3 + Peptide 4 5 correct (+) Peptide 5 Prot Peptide 6 not in the sample (enriched for ‘single hits’) + Peptide 7 Prot Prot Peptide 8 Prot Peptide 9 Prot + Peptide10 Peptide Level: 50% False Positives Protein Level: 71% False Positives
Quantitative Mass Spec Analysis 1. Relative Quantitation a. ICAT: Isotope-Coded Affinity Tags b. Digestion with Oxygen-18 Water c. Spectra Counting and Non-labeling Methodology 2. Absolute Quantitation
Alkylation of Cysteine Residue Cysteine C3H5NOS 103.00918 Carboxymethyl Cys C5H7NO3S 161.01466 58.00548
ICAT Mascot Example Slides
Absolute Quantification Johri et al.Nature Reviews Microbiology4, 932 – 942 (December 2006) | doi:10.1038/ nrmicro1552
Public Web Serverhttp://www.matrixscience.com/search_form_select.html Class Data Download:http://134.192.153.220/GPLS716Local Web Serverhttp://134.192.153.220/mascotUsername: GPLS716Password: GPLS716
MS1 PMF(peptide mass fingerprinting) Search Example • Data: testms1.txt, 210 MS1 peaks • Database: bovine • Fixed modifications : Carboxymethyl (C) Variable modifications : Oxidation (M) • Peptide Tolerance: 0.1 Da • Monoisotopic mass • Mass Value: Mr
Quantification Search Example Data: 18O_BSA_100fmol_1to5_01_071018.RAW.mgf Database: bovine Fixed modifications : Carbamidomethyl (C) Peptide Tolerance: 8 Da (required for O18 labeling) Fragment Tolerance: 0.2 Da Quantification Method: 18O corrected multiplex
MS/MS Database Search Example • Data: BSA onespectra.mgf (one spectra) • Database: bovine • Fixed modifications: Carboxymethyl(C + 58.01) • Varied modifications: Oxidatation(M) • Peptide Mass Tolerance : 0.1 Da • Fragment Mass Tolerance: 0.1 Da • http://www.matrixscience.com/help/fragmentation_help.html
MS2 mixture example • Data: mixture10spectra.mgf • Database: yeast • Fixed modifications : Carbamidomethyl (C+57.02) • Variable modifications : Oxidation (M) • Peptide Mass Tolerance : 0.1 Da • Fragment Mass Tolerance: 0.1 Da
Home Work 1. You will have to download your datasets from the following url:http://134.192.153.220/GPLS716 a. Identification of phosphorylation site : Data:BIG3021307.RAW.mgf Recommend parameters: Database: human. Variable Modification: Phospho(ST) Fixed modification: Carboamidomethyl(C). b. Quantificaiton of oxygen-18/oxygen-16 digested BSA Data: 18O_BSA_500fmol_1to5_071013.RAW.mgf. Submit your search results in pdf or html format to the following email address: proteomicsumb@gmail.com; Please include the following information when you submit your homework 1. Your name and ID in the subject of your email 2. Search parameters 3. A short summary of your search results. Questions: Contact Yunhu Wan, email: ywan@som.umaryland.edu Phone number: 8-2031