Decision Trees
Decision Trees. Farrokh Alemi, Ph.D. Coming Up. How to construct a decision tree? Components of a tree Interviewing decision makers How to analyze a decision tree? Mathematical expectations. Folding back . Example.


Decision Trees
E N D
Presentation Transcript
Decision Trees Farrokh Alemi, Ph.D.
Coming Up • How to construct a decision tree? • Components of a tree • Interviewing decision makers • How to analyze a decision tree? • Mathematical expectations. • Folding back
Example • A preferred provider organization (PPO) has approached the benefit manager of a company of 992 employees. • The PPO offered to discount hospitalization services by 6% and outpatient services by 15% if the company would remove co-payments for employees utilizing the PPO
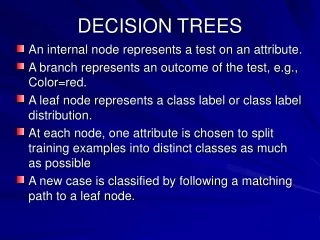
Components of a Tree • Decision • Square node, two arcs and options • Sequence of events • Circle node, arcs and events • Probabilities • Consequences • Utilities or costs
Decision Join PPO Continue as is
Decision Events P2 Hospitalized Hospitalized Join PPO Clinic visit P1 P3 Not hospitalized Not hospitalized No visit P5 Hospitalized Clinic visit P4 Continue as is Not hospitalized P6 Hospitalized No visit Time Not hospitalized
Decision Events Consequences P2 C1 C1 Hospitalized Hospitalized Join PPO C2 C2 Clinic visit P1 P3 C3 C3 Not hospitalized Not hospitalized 0 0 No visit P5 Hospitalized Clinic visit P4 Continue as is Not hospitalized P6 Hospitalized No visit Time Not hospitalized
The Analysis Process Matters • It informs that a decision is looming • Reassures that the analysis is fair • It removes decision makers from day-to-day concerns • It provides new insights while facilitating discussion
Process • Interview decision makers and construct a preliminary tree • Present tree and show how various concerns are captured • Solicit a list of new concerns • Revise tree
New Concerns • Separate general outpatient care from mental health care • Focus on employees who file claims • The PPO clinic might have less efficient practices • Lower co-pay may lead to over utilization • Group practices are more efficient than solo practices • Clinicians may generate their own demand • Show discounts
Cost to employer P2 Hospitalized C1 Meets deductible P4 Clinic visit C2 P1 P3 Outpatient visit Join PPO P5 Mental health visit C3 Claims Less than deductible 0 P7 Hospitalized C4 Meets deductible P9 Clinic visit C5 P6 P8 Outpatient visit Continue as is P10 Mental health visit C6 Claims Less than deductible 0
Estimating Costs • Review of cases at the employer site • Average cost of the sample • Review of cases at the PPO • Adjusted for case mix difference (PPO patients 30% sicker)
.46 Hospitalized .94 *4,796 / 1.3 Meets deductible Clinic visit .98 .85 *1085 .37 .83 Outpatient visit Join PPO .05 Mental health visit .85 * 252 Claims Less than deductible 0 .44 Hospitalized 7,549 Meets deductible Clinic visit .98 .80 *1009 .37 .81 Outpatient visit Continue as is .05 Mental health visit .80 * 240 Claims Less than deductible 0
Analysis of Trees • Folding back • Replace a node with its expectation • Continue until the decision node
1 .44 Hospitalized 7,549 Meets deductible .98 * $807.2 + .05 *$192 = $800.66 .37 .81 Outpatient visit Continue as is Claims Less than deductible 0 .44 * $7,549 + .81 * $800.66 = $3,970.09 2 Meets deductible .37 Continue as is Claims Less than deductible 0 3 .37 * $3,970.09 + .63 * 0 =$1,468.94 Continue as is
Net Impact • Expect cost under continue: • Expected cost after joining PPO: $871.08 • Savings per family per year: $597.86 • Sensitivity analysis • Not sensitive to 5% changes in hospitalization rate • Not sensitive to 5% changes in clinic visit rate • Sensitive to changes in calculation of cost of hospitalization and case mix differences
Myth of Analysis • All options are depicted • Wait for a better offer • All consequences are enumerated • Other health care organizations were on the board of the employer • Assess utilities and fold back using expected utilities • Data are valid • Sensitivity analysis: see if small differences in estimates will change conclusions
Make Your Own • Think through what is the unit of analysis (who decides) • Start with the decision • Think through possible events and consequences • Think through issues that should be captured • Make a draft • Revise to incorporate new issues