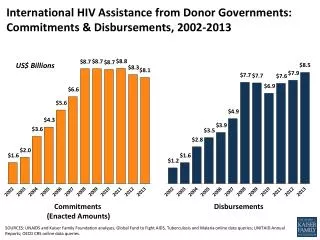
HIV Funding from Donor Governments, 2002-2018
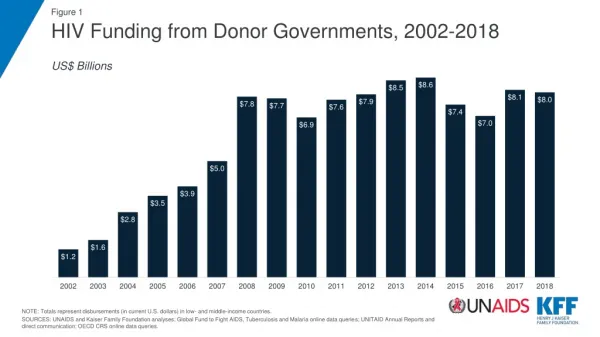
Figure 1. HIV Funding from Donor Governments, 2002-2018. US$ Billions. NOTE: Totals represent disbursements (in current U.S. dollars) in low- and middle-income countries.

HIV Funding from Donor Governments, 2002-2018
E N D
Presentation Transcript
Figure 1 HIV Funding from Donor Governments, 2002-2018 US$ Billions NOTE: Totals represent disbursements (in current U.S. dollars) in low- and middle-income countries. SOURCES: UNAIDS and Kaiser Family Foundation analyses; Global Fund to Fight AIDS, Tuberculosis and Malaria online data queries; UNITAID Annual Reports and direct communication; OECD CRS online data queries.
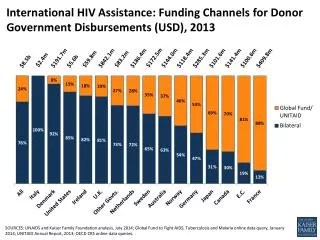
Figure 2 HIV Funding from Donor Governmentsby Funding Channel, 2018 NOTE: Totals represent disbursements (in current U.S. dollars) in low- and middle-income countries. SOURCES: UNAIDS and Kaiser Family Foundation analysis, July 2019; Global Fund to Fight AIDS, Tuberculosis and Malaria online data query, January 2019; UNITAID direct communication; OECD CRS online data queries.
Figure 3 U.S. Bilateral Funding for HIV: Appropriations & Disbursements, FY 2005-FY 2018 US$ Billions Notes: “Appropriations” include bilateral HIV funding as specified by Congress in annual appropriations acts for the State Department, U.S. Agency for International Development (USAID), Centers for Disease Control and Prevention (CDC), and the Department of Defense (DoD). “Disbursements” include actual outlays (i.e. the release of funds to, or the purchase of goods or services for, a recipient) for the State Department, USAID, CDC and DoD. SOURCE: Kaiser Family Foundation analysis of data from the Office of the Global AIDS Coordinator (OGAC) at the Department of State, Office of Management and Budget, Agency Congressional Budget Justifications, Congressional Appropriations Bills, and U.S. Foreign Assistance Dashboard [website], available at: www.foreignassistance.gov.
Figure 4 HIV Funding from Donor Governments, Other than the United States, 2010-2018 US$ Billions NOTE: Totals represent disbursements (in current U.S. dollars) in low- and middle-income countries. SOURCES: UNAIDS and Kaiser Family Foundation analyses; Global Fund to Fight AIDS, Tuberculosis and Malaria online data queries; UNITAID Annual Reports and direct communication; OECD CRS online data queries.
Figure 5 Donor Government Share of Resources Available for HIV Compared to Share of GDP, 2018 NOTES: Donor funding totals represent disbursements (in current U.S. dollars) in low- and middle-income countries. “GDP” represents gross domestic product. UNAIDS estimates that US$19.0 billion was available for HIV from all sources in 2018, expressed in 2016 USD. For purposes of this analysis, the estimate was converted to 2018 USD, or $20.3 billion.SOURCES: UNAIDS and Kaiser Family Foundation analysis, July 2019; Global Fund to Fight AIDS, Tuberculosis and Malaria online data query, January 2019; UNITAID direct communication; OECD CRS online data queries.
Figure 6 Donor Government Ranking by Funding for HIV per US$1 Million GDP, 2018 NOTES: Donor funding totals represent disbursements (in current U.S. dollars) in low- and middle-income countries. “GDP” represents gross domestic product. SOURCES: UNAIDS and Kaiser Family Foundation analysis, July 2019; Global Fund to Fight AIDS, Tuberculosis and Malaria online data query, January 2019; UNITAID direct communication; International Monetary Fund, World Economic Outlook Database, June 2019.