Updates
Updates. PS-11 (PM CEMS), Multi-metals CEMS, Multi-metals Fence Line Monitoring, & CEMS Cost Model. Status of PS – 11 for PM CEMS. Promulgated January 12, 2004 PS-11 (initial correlation) Procedure 2 (ongoing QA/QC) Corrections final November ‘06 Guidance development


Updates
E N D
Presentation Transcript
Updates PS-11 (PM CEMS), Multi-metals CEMS, Multi-metals Fence Line Monitoring, & CEMS Cost Model
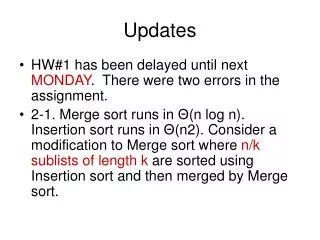
Status of PS – 11 for PM CEMS • Promulgated January 12, 2004 • PS-11 (initial correlation) • Procedure 2 (ongoing QA/QC) • Corrections final November ‘06 • Guidance development • Spreadsheets, statistical tools, problem troubleshooting • Final November ‘06
Applicability of PM CEMS • Work in any stack where filterable PM stack test (Method 17, Method 5, Method 5B or Method 5i) is used for compliance • Work in wet or dry stacks • Some technologies work only in dry stacks and others work in both
Correlation Testing Requirements • Calibration gases not feasible • PM CEMS responses are correlated to reference method for PM concentration using regression analysis • Minimum of 15 test runs simultaneous with PM CEMS responses • Low, medium, high levels
Operational PM CEMS • Electric utilities (coal) • Approximately 8 units • wet stacks and dry stacks • 4 to 5 have passed audit tests showing stability of correlations • Pulp mill recovery boiler (spent liquor) • 3 years of data • 2 solid/liquid incinerators • 2 years of data for one • 15 recent coal-fired utility permits require PM CEMS
PM CEMS Costs • First costs $120K (expected to go down 15% next year) • Includes correlation testing and installation • Annual costs $40K • SO2 CEMS costs for comparison • First costs $134K • Annual costs $30K • COMS costs for comparison • First costs $64K • Annual costs $13K • Adjusted PM CEMS costs for elimination of COMS • First costs $120K - $64K = $56K • Annual costs $40K - $13K = $27K
Regulatory Options • Require PM CEMS • Deviation regulatory language similar to industrial boiler MACT • “Deviation not always a violation” • Or, allow units to have a grace period prior to PM CEMS data becoming enforceable • Make an option, but not require, PM CEMS for units as a replacement for COMS
Future PM CEMS Work • PM 2.5 PM CEMS Development • Dilution technology • Sharp cut cyclones • Beta Gauge for back end gravimetrics • Baldwin Environmental and Desert Research • Hope to go to field in ‘08
Eli Lilly Petitioned EPA for Alternative monitoring for their Haz Waste Incinerator in Lafayette, Indiana Metals, particulate matter (PM), and HCl/Cl Continuous Monitoring in place of parameters (scrubber flow rates, temperatures,etc.) Multimetal CEMS
Concept to Proof • Eli Lilly hired Cooper Environmental • Met with us and OSWER • Program designed together • M-301 testing in the lab to prove quantitative aerosol generator (QAG) • M-301 testing in the field to prove the multimetals CEMS with the QAG • Multimetals CEMS called X-ACT • Non-destructive X-ray Fluorescence analysis (XRF)
Draft Methods from Program • Multimetals CEMS Performance Specification • Multimetals filter method • Multimetals quantitative aerosol generation method • HCL low level performance specification
Multimetal Fence Line Monitoring Real-Time Ambient Metals Emissions Apportionment?
Fugitive Emissions Can Dominate Local Impacts – Not all stacks are created equal Blast Furnace Upset Doctors Clinic School Stack/Ducted Emissions
Xact CEMS Method 301 Validated AMP Approved On-Stack Certified 2.5 Years On-Stack Operations Can it be modified for a fence line monitor application?
Concentration Range of Interest mg/m3 µg/m3 ng/m3 pg/m3 Xact-CEMS Xact-IAP XFM Xact-FLM Fence Line Xact-ATM Air Toxics QAG Validation
Why Multi-Metals FLM? Metals • Eight of EPA’s 33 highest concern pollutants • High local concentrations • Persistent • Under reported Fugitive/Area/Low Emissions • Can dominate local exposure • Infrequent/difficult measurements • High uncertainty Stack Emissions • Uncertain, but MM-CEMS available
Why Short Term averaging? • Protect Health • Accurate emissions assessment • Minimize emissions before they become problem
Xact-CEMS to FLM Transition CEMS to FLM Modifications Inlet Inlet Tape Flow Sampling and Analysis Module Firmware Time Control Module Flow Module
XACT-FLM SAMPLING AND ANALYSIS Sample Flow X-Ray Tube Aerosol Deposit Analysis Area Filter Tape Filter Tape
Traffic Sources (road dust, tail pipe) 12 am - 4 am 4 am - 8 am 8 am - 12 pm Industrial Source (ferromanganese) Multiple Species Contribute to Accurate Apportionment Portland, OR CAMS - January 27, 1978 Percent PM2.5 Mass
09:00 12:00 15:00 18:00 21:00 00:00 Pseudo-deterministic Receptor Model (PDRM) Urban Arsenic – Sydney, FL Ondov, U of MD 2005 As concentration (ng/m³)
This Technology Provides a Tool to: • Assess and protect health • Effectively enforce compliance • Effectively reduce emissions - Near real time response would allow emissions minimization before becoming a problem -
Other Potential Applications • Air quality and emissions assessment • Strategy development and regulation setting • Compliance assurance and enforcement • Emergency response, clean up and solid waste management
Possible Discussion Topics • Regulatory options? • How do these options impact measurements? • Monitor location and number • Reporting times • Where to monitor – fence line or local community? • How close to fence line to be a “fence line monitor”? • Modeling approach
Key Xact-FLM DETECTION LIMITS (µg/m³)* ElementKimoto**Gore** Cr 0.002 0.001 As 0.001 0.0005 Cd 0.01 0.005 Cu 0.002 0.001 Pb 0.002 0.001 Mn 0.002 0.001 Co 0.003 0.002 Ni 0.002 0.001 Se 0.001 0.0006 Ag 0.009 0.004 Sb 0.03 0.01 Range of Interest: 0.01 to 1,000 µg/m3 *95% confidence, interference free **60 minute sampling and analysis, 40 lpm/cm2
Periodic Stack Measurements Plant Operating Model Feed/Fuel Controls Total Emission Estimate PI-ORS FL-Plume Measurements Dispersion/Flow Modeling Total Emission Estimate MM-Xact-FLM Measurements Receptor Modeling Source/Process-Specific Impact Contribution Reconciled Dispersion Modeling -PDRM Total and Source- Specific Emissions Comparison of Emission Estimating Models Measured Impact Model Product
CEMS Revised Cost Model • Crude Computer model early 90’s for SO2 and NOx • 1998 – Updated Menu driven model with real cost data and questionnaire information • 2006 – Updated cost information • Added Bag leak detectors and Hg CEMS • Split PM CEMS into several categories • Xcel Spreadsheet format • EMC website