14 Presenting Qualitative Data
14 Presenting Qualitative Data. For 2004: consider starting with the Crowd warmer up, that is telling the Biggest lie you have ever heard Then do the writing on the board of What makes a good and bad presentation Ideas for making sure your presentation is good.

14 Presenting Qualitative Data
E N D
Presentation Transcript
14 Presenting Qualitative Data For 2004: consider starting with the Crowd warmer up, that is telling the Biggest lie you have ever heard Then do the writing on the board of What makes a good and bad presentation Ideas for making sure your presentation is good
philosophy of communication tell them what you are going to say say it clearly summarize what you have said Effective Communication: "Make them laugh, make them cry, make them think."
Presentation Plan Topic (clear in your mind) Audience (their backgrounds, interest, knowing terminology) Skagit Leadership tomorrow Expectations/Outcomes CAN YOU SAY IN ONE SENTENCE WHAT YOU WANT THEM TO COME AWAY WITH? Time Frame (15 minutes 5-8 main points)
Presentation Plan Learning Principles • Motivation (content relevant to audience's experience, or to important issues) • Association (associate material to ideas, concepts, experiences they already have) • Repetition (hear things over and over) • Senses (appealing to more may get more retention
Presenter Functions Set tone or mood early Objectives stated clearly, early Explanation Examples Alternative view of same idea Indicate your mastery of material Active involvement of audience Bridging/transitions between ideas Summarizing
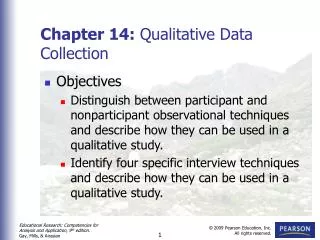
Frame Presentation: Learning Objectives Step 1: Describe the • information, • skills, • behaviors, or • perspectives that participants in the session will acquire through attendance and participation.
Learning Objectives Step 2 : Clearly identify the • outcomes or • actions participants can expect to demonstrate as a result of the educational experience. Use the action words
Learning Objectives Step 3: Write the learning objectives that relate to these outcomes and that reflect the content of the session. Objectives describe the behavior of the learner, and a. are stated clearly; b. define or describe an action; c. are measurable, in terms of time, space, amount, and / or frequency.
Learning Objectives for this class describe different methods of presenting qualitative data, and their applicability to answering research questions posed list factors to consider in making a good presentation
Display of data is crucial: “a visual format that presents information systematically, so user can draw valid conclusions and take needed action” Required reading in Bernard Ch 16, is good here Miles and Huberman: Qualitative Data Analysis is excellent resource
Choice of Forms of Presentation mode of presentation: from simpler to more complex forms • start with quotes complexity • don’t want to lose people by complex arguments data sufficiency & reliability • describe triangulation if used, ie all methods produce same information (or didn't)
Choice of Forms of Presentation select forms of presentation which best explain the data be creative: these are not the only forms available, they are modifiable know your audience • do you have to explain terms/concepts you use? if so, do it well
Use of visuals Best speeches ever, except perhaps one of the first, were made without visual enhancements One of the earliest used two stone tablets
Quotes quotes should support themes balance between excessive analysis, and lengthy quotes without any analysis • "analysis is the search for patterns in data and for ideas that help explain why those patterns are there in the first place" Bernard “smoking is a handicap. Other handicapped people get ramps and such things. Smokers get kicked out."
Quotes quotes are memorable, may be the only aspect of your paper/presentation people remember your EXAMPLES…….
Maps/Diagrams patient’s home social map of area • Slides or photographs body map
CARTOONS Very culture dependent, if you use, know your audience and the effect it will have Examples • Following cartoon, I use for my tourism and health of local populations talk, at the end
PHOTOGRAPHS A thousand words Concern about exploiting people financially by showing their photographs Ethical issues Cultural issues as well in sense that photograph steals the soul Permission and model release
Matrix Displays Not everyone is visually oriented to them Trying to produce good ones help you understand your data, • is analysis Involves information crossing two dimensions to see how they interact
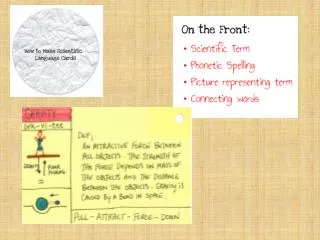
TAXONOMIES How people • Divide up domains • Connect domains
taxonomies of illness (lexicon) could derive from informant interviews, or from successive pile sorts Tree structure Lend themselves to multi-dimensional scaling (MDS) • e.g. Pain Descriptors for Anglo-American Dentists
Box and Arrow Model Causal Flow Charts • takes a long time to get right, • if do it the night before, connect arrows between everything
Presenting Show business
Presentation Handouts Part of syllabus obtained beforehand Distributed before or afterwards Content: Essential elements • Graphics • References • Contact info • Note space Brief or expanded? NOT THE BULLET POINT SLIDES If you don't have enough for everyone? -Distribute to every 2nd or 3rd person -Offer to send to everyone who gives address
Presenting as a group harder to do well if people have varying capabilities tell audience how the presentation will flow use the strengths of the individual presenters well
Data for Communication: words -psychoneurolinguistics pictures feelings emotions understanding
Words, feelings emotions:microphone Don't use if can project voice and all can hear easily Can be a hindrance, especially if have to hold it and use hands as well Can be booming and obtrusive best is a lavalier clipped to you, especially if you move around (get right volume level) • wired or wireless?
microphone if have a microphone on a stand, • if it is cardiod (directional), then it will sound very boomy/bassy if you are close (3-4 inches), so stand back • if it is omnidirectional, then it will feed back (howl), if the gain is turned up • better you speak close to it, and not so loud with any microphone find out where the gain control is
PICTURESvisual information presented slides, overheads, • don't talk and expect people to read material that isn't spoken out FONT, font, font, font, FONT, font, font Font: serif (text) sans-serif (visuals) visual displays should reinforce what you are presenting orally Passing out material (photos, cards), maybe in small group and only if few (1-2) materials
35 mm slide projector can do with large and small audiences • less intimate problem in putting too much on slides so they are illegible -7 lines max • Should be able to read content without loupe modern computer graphics can distract from content, keep it simple
35 mm slide projector if put up quotes and have a large audience far from screen, read the quote • always read or not?
pointer point out stuff, don't wave it around use it sparingly for effect
overheads more intimacy useful to write on during session, if interacting you may stand in the way for some in the audience image may be too low, or too small image not centered, or focused small movements of transparency get magnified
blackboard less popular these days (UBC health sciences) takes more time, audience may appreciate the more relaxed style good way to interact and present material more common in most parts of the world often just a board painted black +chalk-semblance material Poor handwriting: WRITE LARGE
white marker board more modern, easy use of colors can be harder to read because of reflections don't use permanent markers