Download
1 / 12
120 likes | 155 Vues
The use of Remote patient monitoring (RPM) systems to monitor critically ill patients in the Intensive Care Unit (ICU) has enabled quality and real-time healthcare management. Fuzzy logic as an approach to designing RPM systems provides a means for encapsulating the subjective decision-making process of medical experts in an algorithm suitable for computer implementation. In this paper, a remote monitoring system for preterm in neonatal ICU incubators is modeled and simulated. <br>

E N D
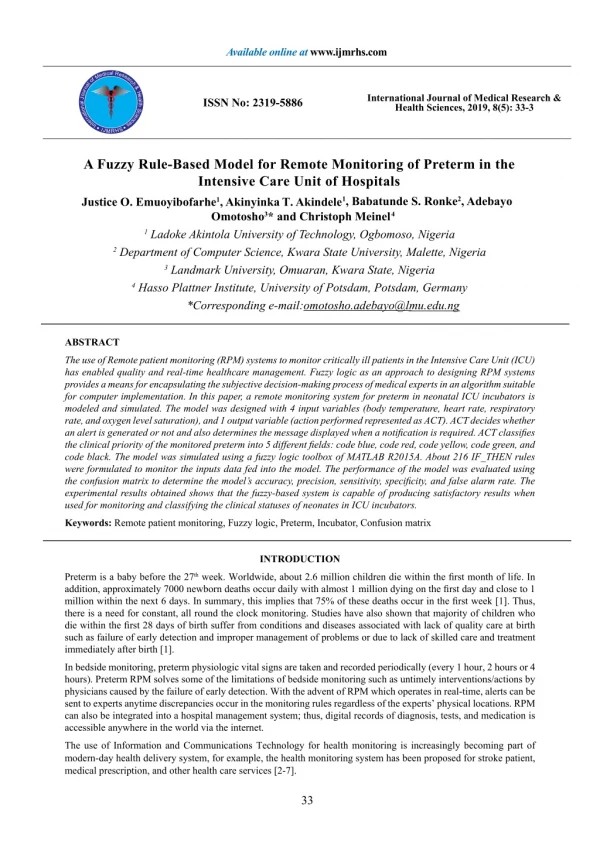
Available online at www.ijmrhs.com InternationalJournalofMedicalResearch&HealthSciences •IJMRHS • International Journal of Medical Research & Health Sciences, 2019, 8(5): 33-3 ISSN No: 2319-5886 A Fuzzy Rule-Based Model for Remote Monitoring of Preterm in the Intensive Care Unit of Hospitals Justice O. Emuoyibofarhe1, Akinyinka T. Akindele1, Babatunde S. Ronke2, Adebayo Omotosho3* and Christoph Meinel4 1 Ladoke Akintola University of Technology, Ogbomoso, Nigeria 2 Department of Computer Science, Kwara State University, Malette, Nigeria 3 Landmark University, Omuaran, Kwara State, Nigeria 4 Hasso Plattner Institute, University of Potsdam, Potsdam, Germany *Corresponding e-mail:omotosho.adebayo@lmu.edu.ng ABSTRACT The use of Remote patient monitoring (RPM) systems to monitor critically ill patients in the Intensive Care Unit (ICU) has enabled quality and real-time healthcare management. Fuzzy logic as an approach to designing RPM systems provides a means for encapsulating the subjective decision-making process of medical experts in an algorithm suitable for computer implementation. In this paper, a remote monitoring system for preterm in neonatal ICU incubators is modeled and simulated. The model was designed with 4 input variables (body temperature, heart rate, respiratory rate, and oxygen level saturation), and 1 output variable (action performed represented as ACT). ACT decides whether an alert is generated or not and also determines the message displayed when a notification is required. ACT classifies the clinical priority of the monitored preterm into 5 different fields: code blue, code red, code yellow, code green, and code black. The model was simulated using a fuzzy logic toolbox of MATLAB R2015A. About 216 IF_THEN rules were formulated to monitor the inputs data fed into the model. The performance of the model was evaluated using the confusion matrix to determine the model’s accuracy, precision, sensitivity, specificity, and false alarm rate. The experimental results obtained shows that the fuzzy-based system is capable of producing satisfactory results when used for monitoring and classifying the clinical statuses of neonates in ICU incubators. Keywords: Remote patient monitoring, Fuzzy logic, Preterm, Incubator, Confusion matrix INTRODUCTION Preterm is a baby before the 27th week. Worldwide, about 2.6 million children die within the first month of life. In addition, approximately 7000 newborn deaths occur daily with almost 1 million dying on the first day and close to 1 million within the next 6 days. In summary, this implies that 75% of these deaths occur in the first week [1]. Thus, there is a need for constant, all round the clock monitoring. Studies have also shown that majority of children who die within the first 28 days of birth suffer from conditions and diseases associated with lack of quality care at birth such as failure of early detection and improper management of problems or due to lack of skilled care and treatment immediately after birth [1]. In bedside monitoring, preterm physiologic vital signs are taken and recorded periodically (every 1 hour, 2 hours or 4 hours). Preterm RPM solves some of the limitations of bedside monitoring such as untimely interventions/actions by physicians caused by the failure of early detection. With the advent of RPM which operates in real-time, alerts can be sent to experts anytime discrepancies occur in the monitoring rules regardless of the experts’ physical locations. RPM can also be integrated into a hospital management system; thus, digital records of diagnosis, tests, and medication is accessible anywhere in the world via the internet. The use of Information and Communications Technology for health monitoring is increasingly becoming part of modern-day health delivery system, for example, the health monitoring system has been proposed for stroke patient, medical prescription, and other health care services [2-7]. 33
Emuoyibofarhe, et al. Int J Med Res Health Sci 2019, 8(5): 33-32 Fuzzy logic has been applied to several sectors and fields. In the field of medicine, it has been applied to predictions, analysis, diagnosis of diseases and ailments. Also, it has been applied to the monitoring of patients in the hospitals, homes, and clinics designed a clinical decision support system to aid prompt and proper decision making by the medical professionals in monitoring neonates in hospitals [8,9]. The CDSS was designed based on 3 input variables (temperature, heart rate, and respiration). The developed system reads the vital signs in analog formats; the ADC will convert the read values to digital format. The converted format will be compared to the pre-set values; if the read value is within the pre-set range, the value will be transmitted to the local server where it will be displayed I graphical format and also sent as SMS to the mobile device of neonatologists. If the read value is outside the range of the pre-set values, an alert is sent to the doctors, nurses and neonates’ parents. However, upon the testing and validation of the system using real data, the designed system is evaluated to have a sensitivity of 77.92%, a specificity of 35.10% and an accuracy of 60.94%, Leite, et al., designed a fuzzy model for monitoring and classifying the conditions of ambulatory patients’ vital signs that works by sending alerts and warnings according to the pre-diagnosis done in order to support the process of medical diagnosis [10]. The researchers extracted the major physiologic signals that interfere directly in the clinical condition of patients with a stroke diagnosis namely: mean blood pressure, systolic blood pressure, diastolic blood pressure and oxygen saturation. But, only the mean blood pressure and partial oxygen saturation were used as inputs into their proposed medical fuzzy system. In their diagnostics and levels of urgency, some cases are classified as a high priority; some are a low priority while some have medium priority depending on the medical experts consulted opinions. While all vital signs fall within their normal range, the diagnostics read “no abnormality” but high priority and medium priority cases trigger an alert to a medical expert. Monitoring, processing, validation, and testing of their fuzzy model were carried out using a database with real-life data. MATLAB 2009a was used for simulating the model and performance evaluation was carried out to measure systems effectiveness, taking into account the pre-adjustment of the relevant functions in the with the aim of reducing false alarms. The implemented system was used by medical experts and the results obtained were satisfactory, with 96% accuracy and 4% false alarms, Joshi, et al., worked on the development of an embedded system for remotely monitoring the parameters-temperature and humidity-inside the incubator for new-born preterm using a GSM module [11]. Peripheral interface controller microcontroller was used for processing the analog signals sent from the incubator’s sensors which afterward are transmitted via the global system for mobile communications to the medical professionals using the application terminal commands. A real-time web-based system for monitoring 4 parameters including temperature, humidity, weight and physical condition of infants was proposed by Kumar, et al., [12]. The application, in addition, has features for controlling temperature and humidity. Since the temperature was considered a critical parameter, redundant sensing was incorporated. LabVIEW 2011 was used for simulating the designed model with hardware and software experiments done using compact field point acquisition module for monitoring and controlling with sensors and actuators. Both the parameters of the incubators and preterm activities were monitored and recorded remotely using a camera and vision assistant software together with LabVIEW 2011. The selected reviews have shown some of the existing solutions and the need to continuously monitor the health status of neonates in ICU incubators. MATERIALS AND METHODS The approach employed in this research work is the modeling and simulation method. In the design of the model for monitoring of preterm, there were 3 main stages involved. It starts from knowledge elicitation where knowledge about relevant vital signs was elicited from medical experts; Creation of fuzzy based preterm monitoring system, where fuzzy logic concepts detect variation in the vital signs (data) of preterm via fuzzy rules and appropriate reaction is triggered; alert generation and transmission for sending alerts if any of the condition in the fuzzy rules are met; the status of the preterm concerned is sent to mobile devices of support and medical experts in-charge for decision making and implementation of relevant intervening actions. Knowledge Elicitation This stage involved the elicitation of information from relevant specialists. Series of interviews were conducted at LAUTECH Teaching Hospital, Nigeria, participated by 3 medical experts (2 from the Paediatrics Department and 1 from Obstetrics and Gynaecology Department). Further consultation was done to verify the knowledge already elicited via a medical expert from the Gynecology Department, UCH, Ibadan, Nigeria. The knowledge elicited was employed in the formulation of fuzzy rules and was also used in the Inference Stage. 34
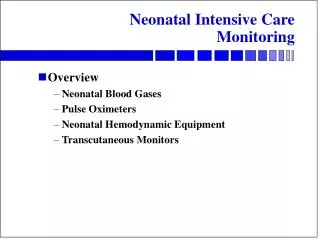
Emuoyibofarhe, et al. Int J Med Res Health Sci 2019, 8(5): 33-32 The summary of the knowledge elicited is as thus, the important vitals signs of preterm are: • Body temperature • Respiratory rate or breathing rate • Heart rate or pulse rate • SPO2 • Blood pressure (diastolic and systolic) The Preterm Monitoring System This is the stage where the fuzzy rules were formulated, premises in the fuzzy rules were tested and conclusions were reached. This stage serves as the intervention and control action stage. It captured the specialists’ knowledge in the same way that lets them (specialists) check the precise timing of the intervention (monitoring) including the alarm system of NICU monitoring gadgets. The design of the fuzzy-based preterm monitoring system can be summarized to have 3 stages: fuzzification stage, inference stage, and defuzzification stage. Some of these stages have multiple steps involved. The architecture of the fuzzy-based preterm monitoring system is shown in Figure 1 while the flowchart is shown in Figure 2. Figure 1 Proposed architecture of the preterm monitoring system Figure 2 Flowchart of the preterm monitoring system Fuzzification Stage Before fuzzification occurs, the parameters (inputs) were represented as linguistic variables. Body temperature was 35
Emuoyibofarhe, et al. Int J Med Res Health Sci 2019, 8(5): 33-32 represented as BT, respiratory rate as RR, heart rate as HR and oxygen saturation level as SP. The output parameter is also represented as a linguistic variable. The action was represented as ACT. Fuzzified inputs: This process is the first step and it helps to characterize the inputs and determine the extent to which each of them belongs to a particular fuzzy set through membership functions. Input variables fuzzy sets and membership functions: The ranges of each input values and their corresponding implications (clinical status) are recorded in Tables 1-4. • Body temperature (BT) membership: In this field, we have 6 fuzzy sets (NCT, SNT, HPT, LFT, MFT, HFT). These fuzzy sets, their ranges and clinical statuses they represent were defined in Table 1. Membership functions of these fuzzy sets were trapezoidal. Table 1 BT ranges that correspond to each fuzzy set Ranges 36.5-37.5°C 35-36.4°C <35°C 37.6-38.4°C 38.5-39.4°C 39.5-40°C Clinical status Normal Core Sub-Normal Hypothermia Low Fever Moderate Fever High Fever Fuzzy sets NCT SNT HPT LFT MFT HFT Input field Body Temperature (BT) • Heart rate membership (HR): Based on the Modified early warning system (MEWS) scoring system and per expert advice, for this input field, 3 fuzzy sets (NHR, BCD, and TCD) were used. Membership functions of these fuzzy sets were trapezoidal. Table 2 shows the HR ranges and clinical status that correspond to each fuzzy set. Table 2 HR ranges that correspond to each fuzzy set Input field Ranges 120-160 <100 >160 Clinical Status Normal Bradycardia Tachycardia Input Fuzzy Sets NHR BCD TCD Heart Rate (HR) • Respiratory rate (HR) membership: As per the expert advice, we use for this input field 3 fuzzy sets (NRR, LRR, and HRR). Membership functions of these 3 fuzzy sets are trapezoidal. Table 3 shows the RR ranges and clinical status that correspond to each fuzzy set. Table 3 RR ranges that correspond to each fuzzy set Input field Ranges Clinical Status Input Fuzzy Sets 40-60 Normal NRR Respiratory Rate (RR) <40 Low LRR >60 High HRR • Oxygen saturation (SP) membership: In this field we have 4 fuzzy sets (NSP, MIHY, MOHY, and SEHY). These fuzzy sets, their ranges and clinical statuses they represent are defined in Table 4. Table 4 SP ranges that correspond to each fuzzy set Input Field Ranges ≥ 95% 90-94% 85-89% <85% Clinical Status Normal Mild Hypoxia Moderate Hypoxia Severe Hypoxia Fuzzy Sets NSP MIHY MOHY SEHY Oxygen Saturation (SP) Output variables fuzzy sets and membership functions: The output variable “clinical status”, refers to the degree of emergency in a neonate’s case. In this system, the output variable is represented by the linguistics term “ACT”. 36
Emuoyibofarhe, et al. Int J Med Res Health Sci 2019, 8(5): 33-32 In our work, there are 5 fuzzy sets for the output variable “clinical status” of the fuzzy logic engine. Membership functions for these sets are triangular. The fuzzy sets details are shown in Table 5. Table 5 Output field fuzzy set, clinical status, and action performed Code Names Code Blue Code Red Code Yellow Code Green Code Black Fuzzy Sets CDB CDR CDY CDG CDW Clinical Status Stable Action Performed (Act) None Send Alert “CDR for patient X” Send Alert “CDY for patient X” Send Alert “CDG for patient X” Send Alert “CDW for patient X” Immediate medical attention needed Unstable Compromised Deceased The inputs values (BT, HR, RR, and SP) are crisp sets and they need to be converted to fuzzy sets. This is done by mapping each input value to its appropriate membership value. The fuzzy set resulting from the mapping is characterized by a membership function that takes values in the interval 0.0-1.0. The mapping and membership curve generated for each input is shown in Figures 3-6, while the mapping and membership curve for the output (ACT) is displayed in Figure 7. Figure 3 Membership function plots for body temperature (BT) Figure 4 Membership function plots for heart/pulse rate (HR) Figure 5 Membership function plots for respiration rate (RR) 37
Emuoyibofarhe, et al. Int J Med Res Health Sci 2019, 8(5): 33-32 Figure 6 Membership function plots for oxygen saturation (SP) Figure 7 Membership function plots for the action performed (ACT) The membership function curve used in this study is the triangular plot as it better represents the functions according to the context. The relevant functions were built using direct method i.e. the specialists presented all the relevant functions data (values that represent each function and the degree of relevance) in order to set them explicitly. Fuzzy Set Operations Fuzzy set operations are the operations used in creating the fuzzy rule base. It combines the input variables by using either the OR or the AND operation using their membership functions (µX). µBT, µRR, µHR, and µSP are the membership functions for fuzzy sets body temperature (BT), respiratory rate (RR), heart rate (HR) and oxygen saturation respectively. The fuzzy operations used on the input fuzzy sets are: OR (union), AND (intersection) • OR (union) operation MAX=Max {µBT (x), µHR (x), µRR (x), µSP (x)} SUM=Min {1, µBT (x)+µHR (x)+µRR (x)+ µSP (x)} • AND (intersection) operations MIN=Min {µBT (x), µHR (x), µRR (x), µSP (x)} PROD=µBT(x)µHR(x)µRR(x)µSP(x)} OR operation is used when the requirement for the conclusion is not all the input vital signs but at least one but the AND operation requires all input values to be represented. Applying the implication method: After evaluating the result of each rule, these results were combined to obtain a final result. This process is called inference. The results of individual rules can be combined in different ways. In MATLAB fuzzy toolbox, there are 3 inbuilt aggregation methods that can be used to combine the results of individual rules. Of these methods, the ‘maximum’ method was employed. The equation for the maximum method used is: Maximum=Max {µTB(x),µRH(x),µRR(x),µSP(x)} 38
Emuoyibofarhe, et al. Int J Med Res Health Sci 2019, 8(5): 33-32 Fuzzy Rule Base A fuzzy rule is a simple IF-THEN rule with a condition (antecedent) and a conclusion. The fuzzy rules were assembled with the following structure: If <premises> Then <conclusion> The premises are the values of the relevant functions (vital signs) while the conclusions are the clinical statuses determined by the medical practitioners. The rule base is the main part of the fuzzy inference system and the quality of results in a fuzzy system depends on the fuzzy rules. The remote monitoring system modeled and simulated in this research work has 216 rules that cover all possible cases. The numbers of rules were obtained using the formula of the below equation. N=VS1 × VS2 ×………× VSn Where N=the total number of possible rules for a fuzzy system, and VSn=the number of fuzzy sets for the input linguistic variable N. The rules were designed based on the MEWS scoring system. And the results with the 216 rules tend to be similar to the MEWS scoring system. In the rule base, every rule has a weight of 1, always termed as unity. Thus, every rule has an equal effect or weight. A sample of the rules is shown in Figure 8. Figure 8 The rule editor of the fuzzy model Inference Stage This step entails the process of formulating the mapping from a given input to an output using fuzzy logic. This mapping provides a basis from which decisions are made. There are 2 types of fuzzy inference systems (FIS) that can be implemented in the fuzzy logic toolbox in MATLAB: Mandani-type FIS and Sugeno-type FIS. Mandani-type FIS was employed in this research work. The reason for using Mandani type over Sugeno type is because Mandani FIS is intuitive, it has widespread acceptance and it is well-suited to human inputs. Defuzzification Stage After the inference step, the overall result which is a fuzzy value, that is, the aggregate of a fuzzy set encompasses a range of output values, and so must be defuzzified in order to resolve a single final crisp output value from the set. The defuzzification method employed is the centroid calculation, which returns the center of gravity under the curve. The equations for the defuzzification stage are: 39
Emuoyibofarhe, et al. Int J Med Res Health Sci 2019, 8(5): 33-32 max ( ) ( ) u du µ =∫ µ u u du Centre of Gravity U min max ∫ min [ ] ∑ ∑ p µ u i i = i 1 p Centre of Gravity for Singletons= [ ] u i = i 1 Left Most Maximum U=inf(u1), µ(u1)=sup(µ(u)) Right Most Maximum U=sup(u1), µ(u1)=sup(µ(u) Model Simulation The simulation of the preterm remote monitoring system was conducted using MATLAB 2015A. MATLAB was used because of the tools available in the application for the development of models and the rapid visualization of the results obtained in the fuzzy system. The MATLAB GUI designed is shown in Figure 9. Alert generation and transmission: In a remote monitoring system, alerts and notifications are very important, the rules and the assigned clinical status to each rule decide when an alert is generated and when it is not. It is also deciding the nature (content) of the alert generated. This research work is a simulation project, thus, there is no component for SMS generation. The assumption is then made to liken alert generation to the clinical status generated by the modeled system. Once a clinical status is generated, it is assumed that the appropriate SMS or pager bleep is generated and sent to the specialists. The system performance evaluation was performed based on 5 metrics: sensitivity, specificity, accuracy, precision and false alarm rate-using the formulas: FP TN FP + False Alarm Rate= TN + Sensitivity= TP FN TN + Specificity= FP TN + TP TN FP TN + TP TP FP + Accuracy= + + TP FN Precision= Where, TP-true positive, FP-false positive, TN-true negative, FN-false negative and FAR-false alarm rate. Figure 9 MATLAB GUI application before data was inputted 40
Emuoyibofarhe, et al. Int J Med Res Health Sci 2019, 8(5): 33-32 RESULTS AND DISCUSSIONS For this research, 5 preterms were observed in LAUTECH Teaching Hospital, Nigeria. Their vital signs were recorded in an interval of 1 hour for 3 days i.e. 24 times a day for 3 days. Thus, each preterm was monitored 72 times. The data was fed into the GUI of the model manually to display the clinical status and appropriately action needed. The experimental results in terms of the frequencies of the occurrence of each clinical status in retrospect to each vital sign monitored are shown in Tables 6-9. Table 6 Frequency of respiratory rate status monitored in neonates’ samples Respiratory Rate High Low Normal Range >65 <40 41-64 Neonate 1 13 8 51 Neonate 2 3 12 57 Neonate 3 10 4 58 Neonate 4 6 5 61 Neonate 5 9 2 61 Table 7 Frequency of body temperature status monitored in neonates’ samples Body Temperature Normal Core Hypothermia Sub-Normal Moderate Fever High Fever Low Fever Range 36-37.9 <35 35-35.9 39-39.9 >40 38-38.9 Preterm 1 48 14 3 2 3 2 Preterm 2 56 8 3 0 2 3 Preterm 3 54 10 2 1 4 1 Preterm 4 57 11 1 0 1 2 Preterm 5 56 10 1 2 1 2 Table 8 Frequency of heart rate status monitored in neonates’ samples Heart Rate Range Neonate 1 Neonate 2 Neonate 3 Neonate 4 Neonate 5 Normal 100-160 55 57 56 63 58 Bradycardia <100 11 6 7 4 8 Tachycardia >160 6 9 6 5 6 Table 9 Frequency of SPO2 (Oxygen Saturation) monitored in neonates’ samples Range 90-94 >95 <80 81-89.9 Neonate 1 5 58 8 1 Neonate 2 5 56 10 1 Neonate 3 15 47 9 1 Neonate 4 1 57 14 0 Neonate 5 1 63 8 0 SPO2 Oxygen Saturation Mild Hypoxia Normal Severe Hypoxia Moderate Hypoxia The clinical status of the preterm was determined based on the fuzzy rules defining the ranges of the respiration rate, body temperature, heart or pulse rate, and oxygen saturation. Based on the values of the aforementioned vital signs recorded; for example, the clinical status of the first preterm baby is found to be compromised 11 times, life- threatening condition 10 times, unstable 5 times and stable 46 times. Therefore, the developed monitoring system only sends “CDY” 11 times, “CDG” 10 times and “CDR” alert 5 times for compromised, life-threatening condition, and unstable respectively. The system did not send alert for 46 times when the preterm was stable. In the manner, the first preterm was monitored so also the other 4 preterms. Performance Evaluation The performance of the developed system in terms of the evaluation metrics: specificity, sensitivity, precision, and accuracy is shown in Figure 10. 41
Emuoyibofarhe, et al. Int J Med Res Health Sci 2019, 8(5): 33-32 Figure 10 A graph of performance metrics with respect to each preterm Figure 11 is the false alarms rate chart. The overall performance of the monitoring system considering the totality of the 5 preterm babies results, the case studies achieved a sensitivity of 95.01%, specificity of 96.34%, precision of 97.68%, false alarm rate of 3.66% and accuracy of 95.55%. Figure 11 A graph of false alarm rate with respect to each preterm Table 10 shows the frequencies of the occurrence of confusion matrix metrics. The results obtained were compared with similar existing systems in Table 11. Table 10 Frequencies of the occurrence of confusion matrix metrics Preterm 1 2 3 4 5 TP 41 40 39 44 47 Average FP 1 1 1 1 1 TN 29 28 28 26 22 FN 1 3 4 1 2 FAR 3.33% 3.45% 3.45% 3.70% 4.35% 3.66% Sensitivity 97.62% 93.02% 90.70% 97.78% 95.92% 95.01% Specificity 96.67% 96.55% 96.55% 96.30% 95.65% 96.34% Precision 97.62% 97.56% 97.50% 97.78% 97.92% 97.68% Accuracy 97.22% 94.44% 93.05% 97.22% 95.83% 95.55% 42
Emuoyibofarhe, et al. Int J Med Res Health Sci 2019, 8(5): 33-32 Table 11 Comparison of patient monitoring systems Proposed rpm Deployment Approach PIC microcontroller PIC microcontroller Networked System No of Vital Signs Monitored Technique Used Target Patient Types False Alarm Rate Author(s) Sensitivity Specificity Accuracy Joshi, et al., (2013) Otalora , et al., (2013) Leite, et al., (2011) Al-Dmour (2013) Sobowale, et al., (2017) Our developed system NA Neonates 2 NA NA NA NA Fuzzy Logic Neonates 3 NA NA NA NA Fuzzy Logic with ANN Adult Patients 2 4.00% NA NA 96.00% Fuzzy Logic NA Adult Patient 5 NA NA NA NA PIC Fuzzy Logic Neonates 3 NA 77.92% 35.10% 60.94% microcontroller Networked System Fuzzy Logic Neonates 4 3.66% 95.01% 96.34% 95.55% CONCLUSION This research was carried out to design a system that can be used in hospitals and clinics to monitor preterm neonates in NICU Incubators. This platform allows the vital signs of the neonates under observation to be recorded digitally, thus, medical experts can observe and monitor these vital signs without being there physically. The system strengthens the capabilities of medical experts to observe neonates’ vital signs across various locations or in different medical facilities. The system activities include vital sign monitoring and alarming services, web-based monitoring applications, and rule-based clinical decision support in different environments. The system continuously monitors critically ill neonates with the objective of reducing the risk of serious harm resulting from the slow provision of health care. The experimental results obtained revealed that the fuzzy-based system produces a satisfactory result in terms of false alarm rate, specificity, sensitivity, precision and accuracy according to the confusion matrix generated. The simulation of the system in MATLAB also showed that fuzzy logic-based model is capable of monitoring and classifying the clinical statuses of neonates based on the vital signs recorded in the NICU incubators and that the system is capable of sending information in form of an alert to experts anytime the condition warrants it. The results of the designed system confirm the effectiveness of fuzzy logic in patient monitoring. There is still need for improvement that allows testing in a real-time environment to show the full clinical potential of this system. The following could also be considered in future work: • The dataset to be used in testing the system should be obtained in real time in a continuous mode instead of numeric format. Also, the sample size should be increased to a larger set to enhance the testing and accuracy of the system • Fuzzy logic should be combined with machine learning algorithms like Support vector machine, linear regression, naïve Bayes, and its variants. Optimization algorithms can be included as well DECLARATIONS Conflict of Interest The authors declared no potential conflicts of interest with respect to the research, authorship, and/or publication of this article. REFERENCES [1] World Health Organization (WHO). Newborns: reducing mortality. 2018, Available at https://www.who.int/ news-room/fact-sheets/detail/newborns-reducing-mortality. [2] Emuoyibofarhe, Justice, et al. “Health Monitoring System for Post-Stroke Management.” International Journal of Information Engineering and Electronic Business, Vol. 11, No. 1, 2019, pp. 1-10. [3] Omotosho, Adebayo, et al. “A neuro-fuzzy based system for the classification of cells as cancerous or Non- cancerous.” International Journal of Medical Research and Health Sciences, Vol. 7, No. 5, 2018, pp. 155-66. 43
Emuoyibofarhe, et al. Int J Med Res Health Sci 2019, 8(5): 33-32 [4] Omotosho, Adebayo, Justice Emuoyibofarhe, and Christoph Meinel. “Ensuring patients privacy in a cryptographic- based-electronic health record using bio-cryptography.” No. 4, 2017, pp. 227-54. International Journal of Electronic Healthcare,Vol. 9, 2017. [5] Omotosho, Adebayo, Justice Emuoyibofarhe, and Christoph Meinel. “Securing e-prescription from medical identity theft using steganography and antiphishing techniques.” Journal of Applied Security Research, Vol. 12, No. 3, 2017, pp. 447-61. [6] Omotosho, Adebayo, Justice Emuoyibofarhe, and Alice Oke. “Securing private keys in electronic health records using session-based hierarchical key encryption.” Journal of Applied Security Research, Vol. 12, No. 4, 2017, pp. 463-77. [7] Omotosho, Adebayo, Ukeme Asanga, and Aderogba Fakorede. “Electronic prescription system for pediatricians.” European Scientific Journal, Vol. 13, No. 18, 2017, pp. 426-37. , Vol. 2013, No. 1, 2013, [8] Singh, Harpreet, et al. “Real-life applications of fuzzy logic.” Advances in Fuzzy Systems pp. 1-3. , V ol. 2013, N o. 1, 2013, pp. 1-3. [9] Sobowale, A. A., et al. Development of a mobile neonatal monitoring system. Proceedings of the 7th international conference on mobile e-services. Adeleke University, Ede, Osun State, 2017, pp. 141-47. [10] Leite, Cicília RM, et al. “A fuzzy model for processing and monitoring vital signs in ICU patients.” Biomedical Engineering Online, Vol. 10, No. 1, 2011, p. 68. [11] Joshi, N. S., R. K. Kamat, and P. K. Gaikwad. “Development of wireless monitoring system for neonatal intensive care unit.” International Journal of Advanced Computer Research, Vol. 3, No. 3, 2013, p. 106. [12] Kumar, Pallerla Akshay, et al. “Real-time monitoring and control of neonatal incubator using LabVIEW.” International Journal of Applied Innovative Engineering and Management, Vol. 2, 2013, pp. 375-80. 44