Indicators in Google Analytics
Do you know what important and usefull information can be found in the Google Analytics? Check our presentation and see which indicators are the most important. More details on http://www.ideoagency.com

Indicators in Google Analytics
E N D
Presentation Transcript
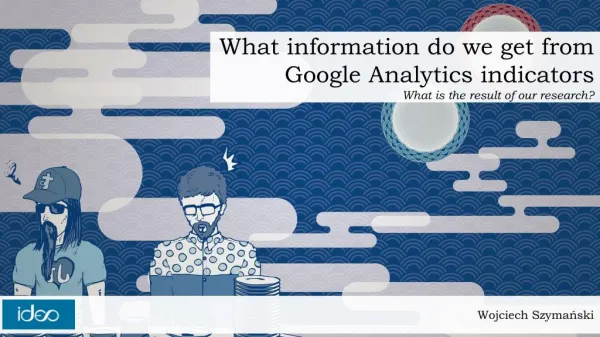
What information do we get from Google Analytics indicators What is the result of our research? Wojciech Szymański
What is and what can be read from Google Analytics? Google Analytics displaysconsiderableamount of data, but we decided to address the basic: (1)Average session duration, (2) Bounce rate, (3) Average number of page views during one session, (4) Percentage of returning users, (5) Percentage of unfinished transactions (6) Average time spent in the basket
Where did we get the data from? (1)We analyzedmultipleeCommercewebsites, (2)We conductedsurveys (3)We analyzedavailablecases
Averagesessionduration Traffic that has a session durationequal 0 or over 10 minutes is worthless for the store. In the interval between 0 and 10 minutes, the value of movement gradually changes (increasesand then decreases), taking its maximum between 2.9 and 3.8 minutes.
Bounce rate There is acertainoptimalbounce rate - between 25% and 55%. An online store whichhas the bounce rate greater than 70% should optimize its performance.
Average number of page views during one session Traffic that has zero or more than 16 views per session is worthless. The optimum numberis between4 and7 page views per session.
Percentage of returning users An online store with zero or fewer returning users is not optimal. You can assume that the optimum store gets between 28% and 70%. In other cases the online store should optimize its activities.
Percentage of unfinished transactions It is normal that some people give up shopping. The higher the ratio of abandonment of the basket the worse, but the ratio should not be higher than 25% - no morethan25 people out of100 may not complete the process of finalizing purchases.
Average time spent in the basket It is extremely difficult to determine the optimal amountof the completion time of the purchase path. Based on analysesand observations, however, it can be stated that it should not last more than 2.5 minutes (150 seconds).
Optimal shop? According to these assumptions - the ideal stores exist…
What else to consider? Conversion funnel
What else to consider? Demographics
What else to consider? Interestinformation
Agencja Interaktywna & Internet Software House E-tools tailor made for your business • Ideo Sp. z o.o. • Wojciech Szymański • Directorof the Internet Marketing Department • www.ideoagency.com • ws@ideo.pl