Download

1 / 75
1.08k likes | 2.32k Vues
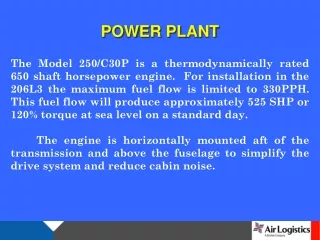
Power Plant Asset Management. Cost Analysis and Cost-Based Power Plant Asset Management –Thermal Power Plant Cycling Costs. Presented by Steven A. Lefton Nikhil Kumar Intertek APTECH 601 West California Avenue Sunnyvale, California 94086 USA Phone: 408-745-7000; Fax: 408-734-0445

E N D
Power Plant Asset Management Cost Analysis and Cost-Based PowerPlant Asset Management –Thermal Power Plant Cycling Costs Presented by Steven A. Lefton Nikhil Kumar Intertek APTECH 601 West California Avenue Sunnyvale, California 94086 USA Phone: 408-745-7000; Fax: 408-734-0445 steve.lefton@Interterk.com
Power Plant Asset Management Know Your Costs- Hot, warm, cold starts, load follow and regulation/AGC costs Reduce Costs of O&M Reduce Operational Damage Results in Lower O&M Reduce Outages and Lost Capacity Reduce Cycles and Optimize Full Load Operations 80-110% of MCR Maximum Rated Capacity Know Plant Component Condition Monitor Plant and Component Life Maximize Plant Value Know Your Market/Mission Compete Based on Costs – Dispatch fleet on costs
Problem Definition Generation Units Originally Designed for Baseload Operations Running in Cycling Modes Low Cycling Costs System Dispatch Current System Operations are Likely to be Very NON-Optimal in Terms of Minimizing Long-Term Revenue Requirements • Increased Maintenance costs • Higher EFOR and Higher Probability plant will not return to service as scheduled.
Typical Production Cost Components Heat Rates Increased; Start-Up Fuel Used; Dynamic Heat Rate Increased; Cycling Related Degradation Cost components affected by cycling
Generation Unit Cycling Definitions Load Cycling LL1: Lowest Load at Which Design SH/RH Temperatures can be maintained LL2: Current “Advertised” Low Load LL3: Lowest Load at Which the Unit can Remain On-Line EHS
Equivalent Hot Start (EHS)Damage measured Standard EHS - Actual ramp rates and maximum load measured
ABB 11N – 3 Starts Cold, Warm, Hot Ramp Rate : 2870˚F/hr Cold, 1955˚F Warm, and 1452˚F/hr Hot
Overall System Costs vs. Average Cycles Per Year for Utility Power Plants Total Capital and Maintenance Costs Resulting from Cycling Equipment (Wear and Tear Costs)
Overall System Costs vs. Average Cycles Per Year for Utility Power Plants Reduced Fuel and Production Costs Incurred by a Unit Cycling to Respond to Real-Time Load Dispatch Needs
Overall System Costs vs. Average Cycles Per Year for Utility Power Plants Capital and Maintenance Costs Resulting from Cycling Equipment (Wear and Tear) Cost Incurred by Inability to Respond to Real-Time Load Dispatch Needs
How Do We Measure the Costs of Increased Cycling? Total Cost of Cycling = D Maintenance and Capital Spending + D Replacement Power Cost Due to Forced Outages + D Long-Term Heat Rate Impacts + D Operational Heat Rate Impacts + D Startup Auxiliary Power and Chemicals + D Startup Fuel and Manpower + D Capital Cost Impacts Due to Unit Life Shortening Here, D Refers Only to Those Costs Attributed to Cycling
Creep Fatigue Interaction (CFI) Design Curves for Several Materials CFI adds significant damage! And shortens life!
Cycling Effect on Plant Reliability Actual Plant Data Reflects CreepFatigue Interaction Design Curve
Cycling Effects on Heat Rate 10% Increase Partially Due to Cycling 1-5% Reasonably Attributable to Cycling
Cycling Effects Accelerated Boiler Failures Due to Cycling Boiler Seals Degradation Tube Rubbing Boiler Hot Spots Drum Humping/Bowing Downcomer to Furnace Sub cooling Expansion Joint Failures
Cycling Effects Accelerated Boiler Failures Due to Cycling (cont’d.) Superheater/Reheater Tube Leg Flexibility Failures Superheater/Reheater Dissimilar Metal Weld Failures Startup-Related Tube Failures in Waterwall, Superheater, and Reheater Tubing Burner Refractory Failure Leading to Flame Impingement and Short-Term Tube Overheating
Best “Simple” Fit of Annual Number of Cycling-Related Tube Failures (During 1982 through 2003)
Corrosion Fatigue Damage of Subcritical Boiler Waterwall Tubing Note oval tube resulting from restrained expansion
Cycling EffectsTurbine Effects Due to Cycling Water Induction to Turbine Increased Thermal Fatigue Due to Steam Temperature Mismatch Steam Chest Fatigue Cracking Steam Chest Distortion Bolting Fatigue Distortion/Cracking Blade, Nozzle Block, Solid Particle Erosion Rotor Stress Increase Rotor Defects (Flaws) Growth
HP rotor bore surface stresses as computed from 1st stage temperatures Stresses at highest rate multiples are limited only because no ramp rate is allowed to exceed the original maximums. To reduce file size, a random 5% of all 50000+points are plotted
Cycling effects on Turbine due to cycling Seals/Packing Wear/Destruction Blade Attachment Fatigue Disk Bore and Blade Fatigue/Cracking Silica and Copper Deposits Lube Oil/Control Oil Contamination Shell/Case Cracking Wilson Line Movement Bearing Damage Reduced Life
Cycling effects on Chemistry due to Cycling Corrosion Fatigue Oxygen Pitting Corrosion Transport to Boiler and Condenser Air, Carbon Dioxide, Oxygen Inleakage (Require NH3 Countermeasures) NH3 - Oxygen Attack on Admiralty Brass
Cycling effects on Chemistry due to Cycling (contd.) Grooving of Condenser/Feedwater Heater Tubes at Support Plates Increased Need for Chemical Cleaning Phosphate Hideout Leading to Acid and Caustic Attack Silica, Iron, and Copper Deposits Out of Service Corrosion
Cycling Effects on Electrical and Control System due to Cycling Increased Controls Wear and Tear Increased Hysteresis Effects that Lead to Excessive Pressure, Temperature, and Flow Controls Not Repeatable Motor Control Fatigue Motor Insulation Fatigue Motor Insulation Failure Due to Moisture Accumulation
Cycling Effects on Electrical and Control System due to Cycling (contd.) Motor Mechanical Fatigue Due to Increased Starts/Stops Wiring Fatigue Insulation Fatigue Degradation Increased Hydrogen Leakage in Generator Fatigue of Generator Leads
Cycling Effects on Electrical and Control System due to Cycling (contd.) Generator Retaining Ring Failures Generator End Turn Fatigue and Arching Bus Corrosion When Cool (i.e., low amps) Breaker Fatigue Transformer Fatigue Degradation
Cycling Effects Increased Risk of Personnel Errors Due to Cycling Implosion Explosion Low Water in the Boiler Water Induction into the Turbine Low Load Instability Improper Valve Alignment Other Man/Machine Interface Problems
How Do We Measure the PossibleLong-Term Costs of Excessive Cycling? Total Cost of Cycling Maintenance/Overhaul Costs Maintenance/Overhaul Time Forced Outage Rates Plant Performance (efficiency) System Production Cost In Short Term Over Long Term Emissions Per kWh Generated Unit Life Expectancies Long-Term Capacity Costs
Factors Affecting Cycling Cost Unit Design Operator Care Already Performed Upgrades for Cycling O&M and Capital Expenditures vs. EFOR System Marginal Energy and Capacity Costs Cost of New Capacity Past Annual Maintenance and Capital Costs Past Cycles
Cost of Cycling Analysis Methods Top-Down Method Annual Cycling damage regression of EHS vs. StartsBottom-Up Method Detailed analysis of 7-10 years of Work orders
Top Down Method Industry Parameters EFOR Maintenance Costs Capital Costs Capacity Replacement Costs Design, Size, etc. Pressure / Temperature Costs vs. Equivalent Hot Starts Statistical Analysis Expert Opinions Plant Operator Surveys Expert Analysis
Annual Damage Accumulation Count and Classify Load Changes Based on Duration, Previous Offline Period, and MW Output Each Classification of Cycling Type has Different Level of Damage Accumulate the Amounts of Damage that Grow Over Time Count all cycles using Rainflow techniques
Rainflow Method: Counting and Classifying Cycles Rotate Load Curve 90 Degrees Imagine Raindrops Rolling down a Roof Circle the Start of the drop Circle the Node when a drop falls past a rooftop Delete all un-circled nodes and label them cycles Define these cycles based on criteria Repeat and count all smaller cycles Load Time
Top-Down Analysis Procedure Annual Damage Accumulation Rates Filtered Capital and Maintenance Costs EFOR History and Costs Statistical “Top-Down” Model Estimates of Maintenance, Capital, and EFOR Costs Per Equivalent Hot Start
Regression Analysis of Relevant Maintenance, Capital, and EFOR Costs for Oil Units 1, 2, and 3
Regression Analysis of Relevant Maintenance, Capital, and EFOR Costs for Oil and Gas Units 1, 2, and 3
Best Estimate of Smoothed Colorado River Unit 5 Maintenance and Capital Costs
Best Estimate of Smoothed Colorado River Unit 5 Forced Outage, Maintenance and Capital Costs