Graduation Rates: Students Who Started 9 th Grade In 2001, 2002, 2003, and 2004
Graduation Rates: Students Who Started 9 th Grade In 2001, 2002, 2003, and 2004 The Bottom Line Statewide graduation rates are steadily increasing overall, according to reports from school districts. However, overall rates are still too low.


Graduation Rates: Students Who Started 9 th Grade In 2001, 2002, 2003, and 2004
E N D
Presentation Transcript
Graduation Rates:Students Who Started 9th GradeIn 2001, 2002, 2003, and 2004
The Bottom Line • Statewide graduation rates are steadily increasing overall, according to reports from school districts. However, overall rates are still too low. • A fifth year of high school increases the graduation rate especially among high need students.
The Bottom Line • The gap between Black and Hispanic students as compared with White students is narrowing. • Graduation rates for English Language Learners and Students with Disabilities are far too low. This is a serious problem. • Graduation rate growth and performance are too uneven among the Big 5. • Among students who graduate, more are earning a Regents Diploma.
Statewide,70.9% of students who started 9th grade in 2004 graduated by June 2008, while 16.3% of those students were still enrolled. 2004 Total Cohort Students =223,726 All Students in Public Schools 4
Graduation rates reported by school districts have increased overall during the past four years. Percentage of Students Graduating with Regents or Local Diploma After 4 Years Results Through June, All Students 5
More students statewide graduate after 5 and 6 years. Percentage of Students Graduating with Regents or Local Diploma After 4, 5 and 6 Years Results Through June • Cohort Membership • 212,272 • 214,628 • 217,199 • 223,726 6
In New York City, the percentage of students graduating increases after the 4th year. Percentage of Students Graduating with Regents or Local Diploma After 4, 5 and 6 Years Results Through June • Cohort Membership • 74,143 • 74,511 • 73,888 • 75,009 7
Credentials Earned by Students Who Graduated As Percent of Total Diplomas Awarded All NYC Public School Students Four Years Five Years Six Years 8
Percentage of Buffalo Students Graduating with Regents or Local Diploma After 4, 5 and 6 Years Results of June Graduates *2001 data reported in whole numbers • Cohort Membership • 2,971 • 2,911 • 3,180 • 3,083 9
Credentials Earned by Students Who Graduated As Percent of Total Diplomas Awarded Buffalo Public School Students Four Years Five Years Six Years 10
Percentage of Rochester Students Graduating with Regents or Local Diploma After 4, 5 and 6 Years Results of June Graduates *2001 data reported in whole numbers • Cohort Membership • 2,374 • 2,550 • 2,281 • 2,220 11
Credentials Earned by Students Who Graduated As Percent of Total Diplomas Awarded Rochester Public School Students Four Years Five Years Six Years 12
Percentage of Syracuse Students Graduating with Regents or Local Diploma After 4, 5 and 6 Years Results of June Graduates *2001 data reported in whole numbers • Cohort Membership • 1,314 • 1,475 • 1,395 • 1,506 13
Credentials Earned by Students Who Graduated As Percent of Total Diplomas Awarded Syracuse Public School Students Four Years Five Years Six Years 14
Percentage of Yonkers Students Graduating with Regents or Local Diploma After 4, 5 and 6 Years Results of June Graduates *2001 data reported in whole numbers • Cohort Membership • 1,598 • 1,670 • 1,695 • 1,831 15
Credentials Earned by Students Who Graduated As Percent of Total Diplomas Awarded Yonkers Public School Students Four Years Five Years Six Years 16
Graduation rates have been increasing across all groups, except American Indians. Percentage of NYS Students Graduating with Regents or Local Diploma After 4 Years Results of June Graduates 18
Achievement Gap in Percentage Between Black vs. White and Hispanic vs. White Students Graduating with Regents or Local Diploma After 4 Years Percentage Point Difference for June Graduates, plus August Graduates 2008
A fifth year makes a difference for Black students. For Black students who started 9th grade in 2003, almost 4,000 more students graduated in the 5th year. Percentage of Students Graduating with Regents or Local Diploma After 4, 5 and 6 Years Results Through June • Cohort Membership • 40,363 • 40,893 • 41,524 • 42,590 20
The same is true for Hispanic students. Of Hispanic students who started 9th grade in 2003, a total of 3,945 more graduated in the 5th year. Percentage of Students Graduating with Regents or Local Diploma After 4, 5 and 6 Years Results Through June • Cohort Membership • 35,753 • 36,867 • 37,971 • 40,498 21
Fifth year gains for White students are smaller. Percentage of Students Graduating with Regents or Local Diploma After 4, 5 and 6 Years Results Through June • Cohort Membership • 120,946 • 120,850 • 121,222 • 123,560 22
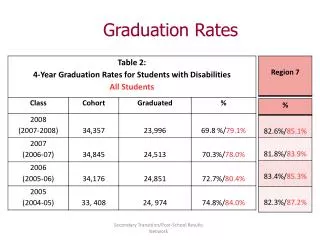
Although 4-year graduation rates for students with disabilities have not improved, more students are remaining in school and fewer are dropping out. Results After 4 Years, Through June GED 1.3% GED 1.4% GED 1.7% GED 1.9% • Cohort Membership • 28,906 • 26,678 • 28,390 • 31,252 23
The graduation rate of students with disabilities has risen and fallen over four years. Percentage of Students Graduating with Regents or Local Diploma After 4, 5 and 6 Years Results Through June • Cohort Membership • 28,906 • 26,678 • 28,390 • 31,252 24
35.7% of ELL students statewide who started 9th grade in 2004 had graduated by June 2008, while 38.8% were still enrolled and had 22.2% dropped out. 2004 Total Cohort Students = 10,846 25
More ELL students graduate after 5 and 6 years, but results are still low. Percentage of Students Graduating with Regents or Local Diploma After 4, 5 and 6 Years Results Through June • Cohort Membership • 13,111 • 9,883 • 10,057 • 10,846 26
2004 Total Cohort Graduation Rate After 4 Years Diplomas Earned by Students Who Graduated All Public School StudentsBy Need/Resource Capacity Category *2001 data reported in whole numbers. Large City Urban-Suburban NYC 27
2004 Total Cohort Graduation Rate After 4 Years Diplomas Earned by Students Who Graduated All Public School StudentsBy Need/Resource Capacity Category *2001 data reported in whole numbers. Rural Average Low 28
Race/ Ethnicity by Diploma Type Of Total Diplomas Awarded 2002-2004 Cohorts 29
Students with Disabilities by Diploma TypeOf Total Diplomas Awarded 2002-2004 Cohorts 30
English Language Learners by Diploma TypeOf Total Diplomas Awarded 2002-2004 Cohorts 31 *Former ELL calculations started in 2003
More Students in the 2004 cohort passed the Regents Exams than graduated in 4 years, but too many students were not tested due to incomplete or failed courses. The percentage of students tested has increased for each exam with noticeable improvement in the percentage of students passing the Regents Exams. Regents Performance of Students in Selected Cohorts After 4 Years of School
A greater percentage of 2004 cohortGeneral Education Students passed the Regents Exams than of the 2004 cohort All Students Group. From 2001 to 2004the percentage of General Education Students tested and passing increased for each Regents exam. Regents Performance of Students in Selected Cohorts After 4 Years of School
Graduation Rates:Students Who Started 9th GradeIn 2001, 2002, 2003, and 2004