Download
1 / 15
150 likes | 181 Vues
Explore the reporting mandates, enrollment and withdrawal codes, and methods used to calculate graduation rates in Forsyth County Schools. Understand the complexities of cohort vs. leaver methods and the impact on tracking student progress. Stay informed on Georgia's current graduation rate calculation and its implications for schools. Address challenges related to data quality, demographics, resource allocation, and community engagement in tracking graduation rates.

E N D
Graduation Rates Forsyth County Schools Sue Derison, Information Systems September 10, 2010
Enrollment and Withdrawal • Enrollment and Withdrawal reported in Student Data Record file and each year end (AYP, State Report Card) • Codes for enrollment type and withdrawal type are mandated by this report
Enrollment Codes • “A” Home School • “B” Previous WD • “C” Continuing • “I” After Incarceration • “N” Never attended (K) • “O” From other state or country • “P” From Private School • “R” Re-entered other • “S” After illness • “T” From another GA system • “U” Within same system • “V” SB10 • “W” School Choice • “S” USCO
Withdrawal Codes (now 26 codes) • “C” Court or Legal • “D” Death • “G” HS Graduation • “H” Home Study • “T” Another GA system • “V” Advanced in system • “W” transfer in system • “X” Out of state, country or to private • “Y” SB10 to State School • “Z” SB10 to private • “1” SB10 to public • “2” School Choice • “3” USCO (Safe School) • “4” DJJ • “5” Non-compulsory
Withdrawal Codes (now 26 codes)Drop Outs • “B” Marriage • “E” Expelled • “F” Financial Hardship/Job • “I” Incarcerated • “L” Low Grades/Failure • “M” Military • “O” Adult Ed/Post Secondary (GED) • “P” Pregnant/Parent • “R” Removed for Lack of Attendance • “S” Serious Illness/Accident • “U” Unknown
AYP/Report • Graduation Rate is used as Second Indicator for high schools in AYP • Schools must have 4 years of data • West 2010-11; Lambert 2013-14 • Graduation Rate and Drop Out Rates are given in the State Report Card issued by Office of Student Achievement
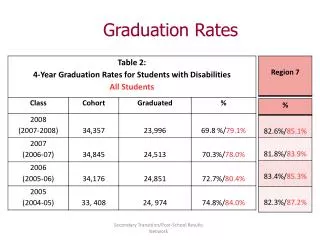
Current Georgia Graduation Rate Method (Lever Method) 2010 -11 Diploma Recipients (Regular Ed) 2008 9thGrade Drop Outs 2009 10thGrade Drop Outs 2010 11thGrade Drop Outs 2011 12thGrade Drop Outs 2011 Completers (5th yr, SE, Att) 2010 -11 Diploma Recipients (Regular Ed)
Change in Graduation Rate Calculation Apples to Oranges Leaver Method: THOSE WHO LEAVE Cohort Method: THOSE WHO STAY TO FINISH WITH THEIR CLASS IN 4 YEARS Required by NCLB all states to implement no later than 2012. Requires use of unique Identifier system.
Cohort Description • In Four Consecutive School Years Plus the Following Summer: • First time 9th graders (Date entered 9th Grade) • Add into group each year all students transferring into the school who have same first time 9th grade year • Subtract all students withdrawing in each of those years • Students found in other districts or documentation confirms non Drop-out will not count against a school • School in GA that has most recent enrollment will be “charged” with the student
Cohort Graduation FormulaBegins and ends with group enter 9th grade 20XX + 4 Years Other Completers SpEd or Att Off-Track Continuers >4 yrs Dropouts On-Time Graduates On-Time Graduates Unknowns
Potential Impact: Lever to Cohort • Indiana • 2006 Persistence Rate: 90% • 2007 Cohort Rate: 76.5% • North Carolina • 2005 On-Time Rate: 96.1% • 2006 cohort Rate: 68.1% • Mississippi • 2003 Completion: 81.3% • 2005 Cohort: 60.8%
Issues for FCS with Change • Change in demographics: increase in subgroups • Continued resource allocation for documentation of withdrawals • School and community understanding of what the graduation rate means and how it will change • Data Quality..Data Quality..Data Quality
Graduation Rate Comparisons • http://r4dashboard.forsyth.k12.ga.us/