Download

1 / 0
0 likes | 125 Vues
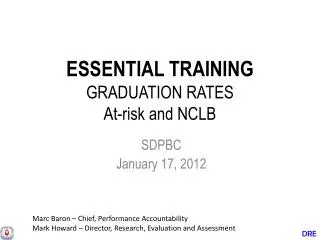
This document presents the graduation rates for essential training programs within the School District of Palm Beach County (SDPBC) as of January 9, 2012. It includes links to the DRE website, PowerPoint presentations detailing school profiles, and handouts providing specific district metrics. The information outlines FY2011 Wcode values ranked from high to low, offering insights into educational performance across various institutions within the district.

E N D