Download
1 / 23
230 likes | 522 Vues
Chemical and Biological Effects on Fishes in a High CO 2 World. A. Ishimatsu, M. Hayashi, K. -S. Lee (Marine Research Institute, Nagasaki University) T. Kikkawa (Marine Ecology Research Laboratory) J. Kita (Research Institute of Innovative Technology for the Earth). Air. Air breathers.

E N D
Chemical and Biological Effects on Fishes in a High CO2 World A. Ishimatsu, M. Hayashi, K. -S. Lee (Marine Research Institute, Nagasaki University) T. Kikkawa (Marine Ecology Research Laboratory) J. Kita (Research Institute of Innovative Technology for the Earth)
Air Air breathers Blood Lung Capillaries Partial Pressure CO2 Tissues O2 Water Water breathers Gill Blood Partial Pressure Capillaries CO2 O2 Comparison of body fluid PCO2 in air- and water-breathers Arterial Blood PCO2 Air-breathers* 15 - 40 torr Water-breathers 1 – 4 torr PCO2 of air/water 0.2 torr
HB H+ + B- pH Log Exposure Time (hrs) CO2 reactions and buffering in animal body CO2 H2CO3 H+ + HCO3- CA HCO3- H+ + CO32- Gills Water Na+ H+ HCO3- Fish Body Cl- LC90 LC50 LC0 96 hrs Auerbach et al. 1997
H2O NaCl Take up NaCl Large volume of urine Osmo- and iono-regulation in seawater and freshwater fish Active transport Seawater Fish Freshwater Fish Passive transport Blood Osmolarity 330 mOsm/L Na+ 200 mmol/L Cl- 160 mmol/L Blood Osmolarity 300 mOsm/L Na+ 150 mmol/L Cl- 120 mmol/L NaCl Drink SW H2O Excrete NaCl (Chloride cell) Sea water Osmolarity 1,000 mOsm/L Na+ 460 mmol/L Cl- 550 mmol/L Fresh water Osmolarity 1 mOsm/L Na+ 0.08 mmol/L Cl- 0.05 mmol/L
Differences in Biological Effects of CO2 and H+ in Water • Effects of CO2 Ocean Sequestration on Fishes
Comparison of fish mortality by CO2 and acid exposures Lethal effect of CO2 and acid on embryos ( N = 5) and larvae (N = 3) of silver seabream at two pH conditions. Exposure period: embryo 360 min, larva 24 h *Significant difference between groups. Kikkawa et al. (2004): Marine Pollution Bulletin 48, 108.
Seawater was acidified by either bubbling with 5% CO2 in air ( ) or adding sulphuric acid ( ) to same pH of 6.2. [HCO3-] pH = pK’ + log a x PCO2 Acid-base responses to CO2 and acid seawater in bastard halibut, Paralichthys olivaceus CO2Exposure Acid Exposure
0 24 48 72 Effects of high CO2 plasma ions and chloride cells of marine fishes PCO2 37 torr Initial 37 torr 22 torr PCO2 7 torr 24 hr Japanese amberjack Gill chloride cells in bastard halibut
Hypercapnia Na+ Gills Cl- Influx Efflux K+ Recovery Control Effects of high CO2 on ion fluxes of freshwater rainbow trout Hypercapnia Kidney Gills Efflux (Blood to water) Influx (Water to blood) Recovery Control Hyperoxia-induced hypercapnia. Wood et al. (1984)
Effect of acid water on ion fluxes of freshwater rainbow trout Unidirectional influx Net flux H+ mEq/kg/hr Cl- Na+ Unidirectional efflux [Ca2+] 0.24 mEq/L, McDonald et al. 1983
Differences in Biological Effects of CO2 and H+ • Physiological responses to CO2 and acids are different. • CO2 readily diffuses into the body, and acidifies body fluid of both intracellular and extracellular compartments. Fish kill mechanism by high CO2 is not fully understood. • Acid exposure inhibits active ion transports across the gills, and increased passive ion movements.The main cause of fish kill by acid exposure is thought not to be blood acidification but cardiac failure by hemoconcentration.
Differences in Biological Effects of CO2 and H+ in Water • Effects of CO2 Ocean Sequestration on Fishes
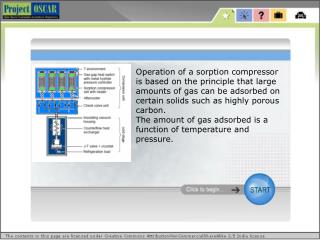
CO2 sequestration by the moving-ship method Initial exposure to high CO2levels followed by rapid decreases in CO2. PCO2 >377 147 45 15 (torr) Depth ca. 2,000-2,500 m Temperature ca. 2-3 C Sato and Sato 2002
60 0 180 0 10 20 30 40 0 10 20 30 Effects of CO2 on cardiovascular system of amberjack 1% CO2 PCO2 7 torr PCO2 37 torr 37 torr Cardiac output (ml/min/kg) Blood pressure (cmH2O) Time (min)
Sudden drop of PCO2 quickly killed the fish. Mortality (%) ca. 100% mortality at 5 kPa No mortality after pre-exposure to 1 kPa PCO2 (kPa) Fish mortality by unsteady exposures to CO2 Effect of step-increase CO2 exposures on fish mortality: Japanese sillago 1 kPa = 7.5 torr
Experiments on deep-sea fish under high pressures High Pressure Chamber (Max 50 MPa) Careproctus trachysoma: Liparididae Known distribution depth 400-800 m Water temperature 2 C
Summary • When tested at the same pH, CO2 and acids produce different effects on fish. Data on mineral acids cannot be used to evaluate effects of CO2. • Still, useful information may be obtained from the literature on the effects of water acidification on fishes, which has already made great impacts on freshwater ecosystems. • Fish kill mechanism by lethal levels of CO2 must be clarified, particularly focusing on the role of cardiac response. • Effects of ocean sequestration need to be investigated; on deep-sea animals, under high pressures, at low temperatures, and in unsteady CO2conditions. • Long-term effects at sublethal CO2 levels on fishes should also be investigated.
PCO2 2 20 200 torr CO2 reception in fish Eel palatine CO2receptors pH of the test solution was 5.0 Test solution acidified by HCl to pH 5.0 gave no response. Yoshii et al. (1980) 0.5 torr PCO2 0.6 6.8 29 111 torr
Effects of long-term CO2 exposure on growth of Japanese sillago Low 3 torr Mid 5 torr Hi 9 torr WT 25 C 34 psu Alkalinity 2.3 mEq/L 1 atm
* 7.6 * * * * 7.2 pHa * * * 6.8 100 80 60 Survival rate (%) 40 20 0 0 4 8 24 48 72 Time (h) Changes in arterial pH and mortality during hypercapnia in bastard halibut * * 22 torr PCO2 7 torr 37 torr
Effect of long-term CO2 exposure on fish growth *Fed normal mineral diet, **Fed low mineral diet AS: Fivelstad et al. (1998), SW: Foss et al. (2003), RT: Smart et al. (1979), WS: Crocker and Cech (1996).
Cardiac output Decreases Blood Pressure Increases Plasma Ion Imbalance Cl- Decreases HCO3- Increases Na+ Increases Reduced Plasma Volume Increased Blood Viscosity H+ Exposure Extracellular to Intracellular Fluid Shift Branchial Ion Loss Cardiac Failure? Adrenergic stimulation Red Blood Cell Swelling Increased Blood Pressure H+ inhibits ion transport at the gills surface. Body fluid acidification may be unimportant as a direct cause of death. CO2 Exposure Body Fluid Acidification pH compensation CO2 readily penetrates into the body to affect physiological functions.
Locomotor responses to CO2 and H+ HCl (decarbonated water) Attracted PCO2 0.2-1.2 torr 2 11 torr 4 8 Avoided CO2 (carbonate water) Avoidance threshold PCO2 2-4 torr Arctic char (Jones et al. 1985)