Download
1 / 44
440 likes | 774 Vues
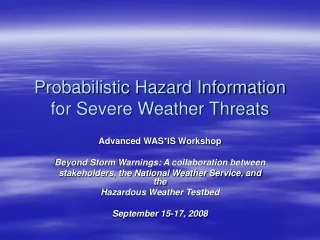
Using Ensemble Probability Forecasts and High Resolution Models To Identify Severe Weather Threats. Josh Korotky NOAA/NWS, Pittsburgh, PA and Richard H. Grumm NOAA/NWS, State College, PA. Overview. Review a vigorous and a marginal severe weather event

E N D
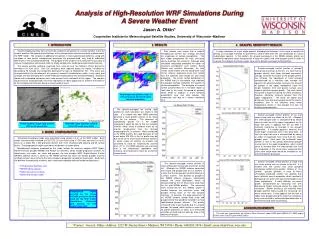
Using Ensemble Probability Forecastsand High Resolution ModelsTo Identify Severe Weather Threats Josh Korotky NOAA/NWS, Pittsburgh, PA and Richard H. Grumm NOAA/NWS, State College, PA
Overview • Review a vigorous and a marginal severe weather event • Examine diagnostic fields from the NAM-WRF • Examine single and combined probability forecasts from the SREF • Examine threshold probabilities for: • CAPE • Storm-Relative Helicity (SRH) • Mean shear (total shear divided by shear depth) • The Energy Helicity Index (EHI) • The Supercell Parameter • The Significant Tornado Parameter • Examine the combined probability of MUCAPE > 1000 J/kg, effective bulk shear > 30/40 kts, and 3 hr. convective precipitation > .01 inch
Overview • This study illustrates the value of using diagnostic information from higher resolution models with probability information from SREF forecasts to better understand the nature of a severe weather threat potential • A forecast strategy is proposed: • Use ensemble data for assessing the likelihood of a severe weather event and the confidence level of NWP forecasts • Uncertainty information is critical for forecast users • Use climatological anomalies for evaluating the historical context of a model forecast • Important for users to appreciate possible impacts • Use high resolution model data for determining the timing, evolution, mode, and intensity of forecast convection, including important mesoscale structures and relevant forcing mechanisms • The devil is in the model details
SREF Configuration • EMC runs a 21 member multi-model, multi-analysis system with enhanced physics. The SREF is run four times daily at 03, 09, 15, and 21 UTC, with forecasts to 87 hours • The current SREF configuration: • 10 NAM-Eta members • 5 Regional Spectral Model (RSM) members • 6 WRF members • Why SREF? • SREF designed to address both initial state and model uncertainties
Introduction – Case 1 • A deep cyclone and frontal system brought severe weather to much of the central Mississippi and lower Ohio Valleys on 2 April 2006 • 871 severe weather reports • 85 tornadoes • 29 deaths
SPC Day One Outlook04/02/06 UTC valid 0402/12 UTC – 0403/12 UTC
SPC SREF ForecastsApril 02/09 UTC valid April (02-03)/(21 – 00) UTC • Single and combined probabilities - David Bright • http://www.spc.noaa.gov/exper/sref/
04/02/09Z valid 0402/21 UTC 04/02/09Z valid 0403/00 UTC Prob Effective Shear ≥ 40 kts, Mean Effective Shear ≥ 40 kts (yellow) Prob Effective Shear ≥ 40 kts, Mean Effective Shear ≥ 40 kts (yellow) Prob Conv Precip ≥ .01 in x Prob MUCAPE ≥ 1000xProb Eff Shr > 40 kts Prob Conv Precip ≥ .01 in x Prob MUCAPE ≥ 1000xProb Eff Shr > 40 kts
04/02/09Z valid 0402/21 UTC 04/02/09Z valid 0403/00 UTC Prob Supercell Composite ≥ 3, Mean Supercell Composite = 3 (yellow) Prob Supercell Composite ≥ 3, Mean Supercell Composite = 3 (yellow) Prob Sig Tor ≥ 3, Mean Sig Tor = 3 (yellow) Prob Sig Tor ≥ 3, Mean Sig Tor = 3 (yellow)
SREF Departures from Climatology andProbability Forecasts April 01/21Z valid April 02/00Z • Climate anomaly: SREF forecasts assessed relative to seasonal climatology; Rich Grumm • http://nws.met.psu.edu/ensembles/index.html • http://eyewall.met.psu.edu/ensembles/
SREF init: 21Z01APR2006 valid 00Z03APR2006 Mean MSLP and Anomaly (shaded) a. b. SREF init: 21Z01APR2006 valid 00Z03APR2006 Mean PWAT and Anomaly (shaded SREF MSLP and PWAT Anomalies valid 00Z 03APR2006 • Deepening surface cyclone • Central pressure forecast > 2 SD below climate normal over the upper Mississippi Valley • Moist air surging poleward • PWAT anomalies forecast 2 to 3 SDs above climate normal • CAPE anomaly + 2-3 SD (not shown)
SREF init: 21Z01APR2006 valid 00Z03APR2006 Mean CAPE (shaded) and EHI a. b. SREF init: 21Z01APR2006 valid 00Z03APR2006 SR-Helicity (shaded);1.5 km Shear (103) & vectors Mean CAPE (shaded) and EHI Mean CAPE, SRH, EHI, Shear Forecastsvalid 00Z 03APR2006 • Mean CAPE 1200-2500 Jkg-1 • Mean EHI 1-3 from Illinois to lower Mississippi Valley • Mean SRH 300-400+ m2s-2 along and north of a strong warm front • Mean SRH 200-300+ m2s-2 along and east of the cold front • Mean 1.5 km mean shear .009-.010+ s-1 (~30 kt) across the Mississippi Valley Mean SRH (shaded) and 1.5 km Shear ≥ .006 s-1
a. SREF NARR 21Z01APR2006 valid 00Z03APR2006 Prob CAPE > 2000 Jkg-1; Mean CAPE ≥ 1200 Jkg-1 SREF 09Z01APR2006 valid 00Z03APR2006 Probability CAPE > 1000 Jkg-1 b. Prob CAPE ≥ 2000 m2s2 (shaded) Mean CAPE ≥ 1200 J/kg SREF CAPE Threshold Probabilitiesvalid 00Z 03APR2006 • CAPE forecast to exceed 2000 J/kg from southern IL (>30%) to TX (> 90%) • CAPE forecast to exceed 1000 J/kg(70% - 90%) across much of the Mississippi Valley Prob CAPE ≥ 1000 J/kg
SREF NARR 21Z01APR2006 valid 00Z02APR2006 Probability 1.5km shear > .006 s-1 a. SREF 09Z01APR2006 valid 00Z03APR2006 Probability SRH > 200 m2s2 b. Prob 1.5 km shear ≥ .006 s-1 (shaded);mean shear ≥ .006 s-1 SREF Shear and SRH Threshold Probabilities valid 00Z 03APR2006 • Mean shear will likely exceed .006 s-1(> 90%)across entire outlook region …ranging from .012 - .018 s-1 • SRH will likely exceed 200 m2s2(50% - 70+%) along and east of cold front Prob SRH ≥ 200 m2s2
SREF Summary • SREF departures from climatology indicate an anomalously deep cyclone with atypical moisture and instability in the warm sector • SREF forecasts indicate a high likelihood of severe weather… including a potential for supercells with significant tornadoes… across much of the lower and central Mississippi Valley on 2 April 2006 • Additional SREF products (not shown) indicated considerable agreement among the ensemble members • Users need to know that forecast confidence is high for a high impact event
NCEP Operational NAM-WRF Graphics • 00 UTC and 1200 UTC: • http://www.emc.ncep.noaa.gov/mmb/mmbpll/nampll12_fullcyc_2mbtop/index.html • 0600 UTC and 1800 UTC: • http://www.emc.ncep.noaa.gov/mmb/mmbpll/opsnam_offtime/index.html
NAM-WRF and SREF NAM-WRF Dew point valid 0403/00 UTC SREF Probability of the 2m Dew Point > 60o Fvalid 0403/00 UTC • SREF: Greater than 90% probability of the surface dew point > 600 F across central and southern Mississippi Valley • NAM-WRF illustrates distribution and magnitude of warm sector dew points
NAM-WRF Best CAPE • CAPE forecast 2000-3000J/kg along and ahead of the cold front • NAM-WRF illustrates distribution and magnitude of warm sector instability
NAM-WRF Forcing and Vertical Wind Shear (not shown) • NAM-WRF highlighted important forcing mechanisms in a forecast of significant low-level frontogenesis and strong moisture flux convergence along the frontal features • NAM WRF substantiated the SREF probabilities of a highly sheared environment and added details to magnitude and distribution of shear
Conv Pcp Rate - 36 H Forecast valid 0403/00 UTC Instant Pcp Rate - 36 H Forecast valid 0403/00 UTC NAM-WRF Instant and Convective Precipitation • NAM-WRF instant and convective precipitation shows convective potential along banded frontal structures and grid scale precipitation northwest of the surface cyclone
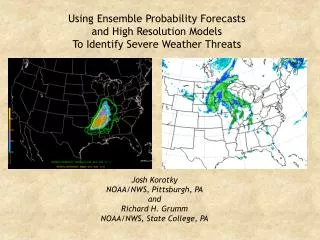
a. b. Mosaic of radar base reflectivity valid 0001 UTC 3 April 2006 NAM-WRF Simulated Radar Reflectivity • Although it is not valid to make direct comparisons between actual and simulated radar at 12 km resolution… simulated radar can reveal important details about the mode of convection and evolution of a severe storm environment • Indicates banded frontal and pre-frontal structures with a potential for cellular elements…which correspond rather well with the actual radar, even though the actual radar shows much greater reflectivities in the convection NAM-WRF 24 hr forecast of simulated refl at 1 km AGL – valid 04/03/0000 UTC
a. b. Mosaic of radar base reflectivity valid 0001 UTC 3 April 2006 Mosaic of radar base reflectivity valid 0001 UTC 3 April 2006 NAM-WRF 24 hr forecast of simulated refl at 1 km AGL – valid 04/03/0000 UTC WRF-NMM4 24 hr forecast of simulated refl at 1 km AGL – valid 04/03/0000 UTC
Summary – Case 1 • SREF graphics indicated the likelihood of a severe weather event with a high potential for supercells and tornadoes across the mid Mississippi Valley on 2 April 2006. EPS forecasts also indicated substantial agreement between the 21 SREF members… increasing confidence in the forecast • Climate anomalies indicated the event would be associated with an uncharacteristically deep surface cyclone and an anomalously moist warm sector • High resolution model data helped fill in the details of the mode, evolution, and intensity of forecast convection, and highlighted important mesoscale structures, including relevant forcing mechanisms
Overview – Case 2 • A marginal severe weather event occurred across parts of the Ohio Valley and Pennsylvania on 4 October 2006
October 04, 2006 Ohio Valley Severe Weather • A frontal system moved southward across the Ohio Valley and PA during the late afternoon/evening of 10/04/06 • Significant heating/destabilization were questionable because morning convection was expected across OH and PA • 35 to 45 kt mid-level flow was expected across the region ahead of front • SPC highlighted locally-damaging winds and some hail… with storms organized linearly along/ahead of the front
10/04/09Z valid 10/04/21Z Prob Conv Precip ≥ .01 inx Prob MUCAPE ≥ 1000xProb Eff Shr > 40 Prob Conv Precip ≥ .01 inx Prob MUCAPE ≥ 1000xProb Eff Shr > 30 Craven Brooks Mean Sig Svr and Standard Deviation Mean MUCAPE (shaded/contour), Eff shear vectors, 3km SRH (green)
10/04/09Z valid 10/04/21Z Prob Supercell Composite > 1 and Mean Supercell Comp = 1 Prob Craven Brooks Sig Svr > 20000 and Mean Sig Svr = 20000
10/04/09Z valid 10/04/21Z • PWAT 2-3+ SD above climate norm….MSLP 1-2 SD above climate norm Mean MSLP Forecastand Normalized Climate Anomaly Mean Precipitable Water Forecastand Normalized Climate Anomaly
CAPE (shaded) and EHI 10/04/09Z valid 10/04/21Z • Mean CAPE < 1200 J/kg (PA); > 1200J/kg OH and IN • Mean EHI ≤ 1 IN/OH
10/04/09Z valid 10/04/21Z SRH (shaded), 5km Shr > .003 s-1 • Mean SRH < 150 m2/s2 PA; 150-200+ m2/s2 along/south of front • Mean deep (5 km) Shear ≤ .003 s-1 (30 kt) along front • Mean low-level (1.5 km) Shear ≤ .006 s-1 (18kt) along front 1.5km Shr > .003 s-1
10/04/09Z valid 10/04/21Z Prob CAPE > 1200 J/kg • Prob CAPE > 1200 J/kg 30% PA to 70+% OH • Mean EHI < 1 • Prob EHI > 1 20-30% Prob EHI > 1
SREF Summary • SREF single and combined probabilities illustrate an environment marginally favoring severe weather from organized convection across the parts of the Ohio Valley and Pennsylvania on 10/04/06 • Isolated supercells are possible but not probable. Tornadoes are unlikely • Main threat: damaging winds
10/04/12Z valid 10/04/21Z Front CAPE 1500-2000 Pre-frontal mconv Supercell composite Front EHI 3+, 0-3km Shear >.007s-1
10/04/12Z valid 10/04/21Z Significant Severe 30000+ SRH 150-200+
10/04/12Z valid 10/04/21Z 850 mb 500 mb 700 - 500mb Frontal Omega 850 - 500mb Frontal Omega 250 mb 500 - 300mb Frontal Omega 200 mb – 300 mb Divergence
10/04/12Z valid 10/04/21Z 850 mb 500 mb 250 mb
NAM-WRF Summary • NAM-WRF depicts more unstable environment with greater shear than SREF • It appears high resolution model provides valuable additional information …especially when a marginal severe event is expected
Simulated Radar Reflectivity, Real-time Satellite and Radar 10/04/09Z valid 10/04/21Z (L) and 22Z (C and R)