Download
1 / 47
470 likes | 504 Vues
This system utilizes ECMWF ensemble weather forecasts for operational flood forecasting in Bangladesh. It provides probabilistic rainfall and river discharge forecasts with varying lead times, aiding in disaster management. The system was developed in collaboration with various stakeholders and incorporates historical flood data to enhance accuracy. By leveraging advanced forecasting techniques, it aims to improve flood warning lead times and mitigate the impact of severe flooding events in the region.

E N D
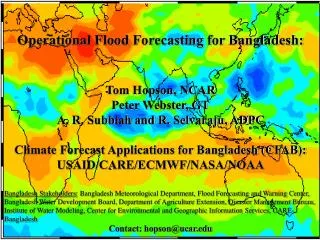
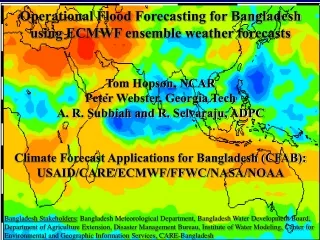
Operational Flood Forecasting for Bangladesh using ECMWF ensemble weather forecasts Tom Hopson, NCAR Peter Webster, Georgia Tech A. R. Subbiah and R. Selvaraju, ADPC Climate Forecast Applications for Bangladesh (CFAB): USAID/CARE/ECMWF/FFWC/NASA/NOAA Bangladesh Stakeholders: Bangladesh Meteorological Department, Bangladesh Water Development Board, Department of Agriculture Extension, Disaster Management Bureau, Institute of Water Modeling, Center for Environmental and Geographic Information Services, CARE-Bangladesh
Three-Tier Overlapping Forecast SystemDeveloped for Bangladesh SEASONAL OUTLOOK: “Broad brush” probabilistic forecast of rainfall and river discharge. Updated each month. Produced out to 6 months, currently most useful skill out 3 months 20-25 DAY FORECAST: Forecast of average 5-day rainfall and river discharge 3-4 weeks in advance. Updated every 5 days. 1-10 DAY FORECAST: Forecast of rainfall and precipitation in probabilistic form updated every day. Considerable skill out to 5-days. Moderate skill 5-10 days.
Bangladesh background • About 1/3 of land area floods the monsoon rainy season • Size: roughly the size of UK (144,000 sq km) • Border countries: Burma (193 km), India (4,053 km) • Population: 140 million • 36% of population below poverty line • Within the top 5 of: poorest and most densely populated in the world Natural disasters: • Nov 1970 Bhola cyclone -- at least 300,000 died in 20 min (12m) • April 1991 Bangladesh cyclone -- 138,000 died (6m) • Nov 2007 Sidr cyclone -- 5-10,000 died
River Flooding Damaging Floods: • large peak or extended duration • Affect agriculture: early floods in May, late floods in September Recent severe flooding: 1974, 1987, 1988, 1997, 1998, 2000, 2004, and 2007 • 1998: 60% of country inundated for 3 months, 1000 killed, 40 million homeless, 10-20% total food production • 2004: Brahmaputra floods killed 500 people, displaced 30 million, 40% of capitol city Dhaka under water • 2007: Brahmaputra floods displaced over 20 million (World Food Program)
2004 dry season river flows … NASA Aqua/Modis images … and during the July flooding event
Overview: Bangladesh flood forecasting CFAB History -- Sea-level impacts on flooding II. 1-10 day Discharge Forecasting 1. precipitation forecast bias removal 2. multi-model river forecasting 3. accounting for all error: weather and hydrologic errors III. 2007 Floods and Warning System Pilot Areas
Sea Level Impacts • Very flat topography • Can changes in Bay of Bengal sea level height significantly affect river flooding over the whole country?
Ocean Dynamics Effecting Sea-Level in the Bay of Bengal Indian Ocean Zonal Mode Baroclinic Coastal Kelvin Wave (results by Weiqing Han)
How important are (“forecastable”) interannual sea level variations (and climate change impacts) on country-wide extreme flooding events? Approach: without extensive knowledge of river hydraulic properties, instead do simplified “scale analysis” (linearization) of the governing equation (“dynamic equation of gradually-varied flow”) to get approximate solution. (Answer: effects impact river heights roughly 200km upstream, but *not* over the whole country)
Sea Level Impacts disasterous flood year Calculation: linearize the depth-integrated Navier-Stokes equation about the “normal depth” Dn Results: exponential decrease of sea-level impacts with e-folding length Dn / (3S0)~150km • Backwater effects limited to lower third of country and bounded by roughly 30cm • Severe flood years affect whole country, with water depth variations of O(1m) => Look at precipitation-driven effects on flooding September 1998
CFAB Project: Improve flood warning lead time • Problems: • Limited warning of upstream river discharges • Precipitation forecasting in tropics difficult Good forecasting skill derived from: 1. good data inputs: ECMWF weather forecasts, satellite rainfall 2. Large catchments => weather forecasting skill “integrates” over large spatial and temporal scales 3. Partnership with Bangladesh’s Flood Forecasting Warning Centre (FFWC) => daily border river readings used in data assimilation scheme
1) Rainfall Estimates Rain gauge estimates: NOAA CPC and WMO GTS 0.5 X 0.5 spatial resolution; 24h temporal resolution approximately 100 gauges reporting over combined catchment 24hr reporting delay Satellite-derived estimates: Global Precipitation Climatology Project (GPCP) 0.25X0.25 spatial resolution; 3hr temporal resolution 6hr reporting delay geostationary infrared “cold cloud top” estimates calibrated from SSM/I and TMI microwave instruments 3) Satellite-derived estimates: NOAA CPC “CMORPH” 0.25X0.25 spatial resolution; 3hr temporal resolution 18hr reporting delay precipitation rain rates derived from microwave instruments (SSM/I, TMI, AMSU-B), but “cloud tracking” done using infrared satellites
Spatial Comparison of Precipitation Products Monsoon season (Aug 1, 2004) Indian subcontinent TRMM
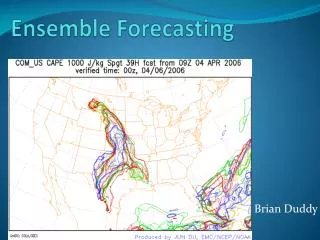
Weather Forecasts for Hydrologic ApplicationsECMWF example • Seasonal -- ECMWF System 3 - based on: 1) long predictability of ocean circulation, 2) variability in tropical SSTs impacts global atmospheric circulation - coupled atmosphere-ocean model integrations - out to 7 month lead-times, integrated 1Xmonth - 41 member ensembles, 1.125º X 1.125º (TL159L62), 130km • Monthly forecasts -- ECMWF - “fills in the gaps” -- atmosphere retains some memory with ocean variability impacting atmospheric circulation - coupled ocean-atmospheric modeling after 10 days - 15 to 32 day lead-times, integrated 1Xweek - 51 member ensemble, 1.125º X 1.125º (TL159L62), 130km • Medium-range -- ECMWF EPS - atmospheric initial value problem, SST’s persisted - 6hr - 15 day lead-time forecasts, integrated 2Xdaily - 51 member ensembles, 0.5º X 0.5º (TL255L40), 80km Motivation for generating ensemble forecasts (weather or hydrologic): • a well-calibrated ensemble forecast provides a prognosis of its own uncertainty or level of confidence
Rule of Thumb: -- Weather forecast skill (RMS error) increases with spatial (and temporal) scale => Utility of weather forecasts in flood forecasting increases for larger catchments -- Logarithmic increase
Merged FFWC-CFAB Hydraulic Model Schematic Primary forecast boundary conditions shown in gold: Ganges at Hardinge Bridge Brahmaputra at Bahadurabad 3) Benefit: FFWC daily river discharge observations used in forecast data assimilation scheme (Auto-Regressive Integrated Moving Average model [ARIMA] approach)
Transforming (Ensemble) Rainfall into (Probabilistic) River Flow Forecasts Rainfall Probability Discharge Probability Rainfall [mm] Discharge [m3/s] Above danger level probability 36% Greater than climatological seasonal risk?
ECMWF 51-member Ensemble Precipitation Forecasts 5 Day Lead-time Forecasts => Lots of variability • 2004 Brahmaputra Catchment-averaged Forecasts • black line satellite observations • colored lines ensemble forecasts • Basic structure of catchment rainfall similar for both forecasts and observations • But large relative over-bias in forecasts
Specific Necessity of Post-ProcessingWeather Forecasts for Hydrologic Forecasting Applications Hydrologic forecast model calibration can often implicitly remove biases in input weather variables (i.e. precipitation) However, if you use one product (i.e. satellite rainfall) to calibrate your hydrologic model, but use *more* than one product (i.e. satellite rainfall and numerical weather prediction rainfall) or weather forecasts at different lead-times (with different biases for each lead-time) to generate hydrologic forecasts, then biases *between* each product or forecast lead-time must be removed This is because hydrologic model calibration cannot (implicitly) remove all biases of all input weather products simultaneously
What do we mean by “calibration” or “post-processing”? “bias” obs Forecast PDF Probability Probability Forecast PDF obs “spread” or “dispersion” calibration Basin Rainfall [mm] Basin Rainfall [mm] • Post-processing has corrected: • the “on average” bias • as well as under-representation of the 2nd moment of the empirical forecast PDF (i.e. corrected its “dispersion” or “spread”)
Forecast Bias Adjustment • done independently for each forecast grid • (bias-correct the whole PDF, not just the median) Model Climatology CDF “Observed” Climatology CDF Pmax Pmax Precipitation Pfcst Padj 25th 50th 75th 100th 25th 50th 75th 100th Quantile Quantile In practical terms … ranked forecasts ranked observations 0 1m 0 1m Precipitation Precipitation
Bias-corrected Precipitation Forecasts Original Forecast Brahmaputra Corrected Forecasts Corrected Forecast => Now observed precipitation within the “ensemble bundle”, and preserving spatial and temporal covariances
A Cautionary Warning about using Probabilistic Precipitation Forecasts in Hydrologic Modeling (Importance of Maintaining Spatial and Temporal Covariances for Hydrologic Forecasting => one option: “Schaake Shuffle”) ensemble1 ensemble2 ensemble3 River catchtment A subC subB QC QB QA QA same For all 3 possible ensembles Scenario for smallest possible QA? No. Scenario for largest possible QA? No. Scenario for average QA?
Rank Histogram Comparisons (better but not perfect!) Original Adjusted
Quantile Regression approach:maintaining skill no worse than “persistence” for non-Gaussian PDF’s (ECMWF Brahmaputra catchment Precipitation) 1 day 4 day • “Multi-model” statistical approach applied to NCAR’s WRF mesoscale ensemble forecasts 7 day 10 day
Discharge Multi-Model Forecast • Multi-Model-Ensemble Approach: • Rank models based on historic residual error using current model calibration and “observed” precipitation • Regress models’ historic discharges to minimize historic residuals with observed discharge • To avoid over-calibration, evaluate resultant residuals using Akaike Information Criteria (AIC) • If AIC minimized, use regression coefficients to generate “multi-model” forecast; otherwise use highest-ranked model => “win-win” situation!
2003 Model Comparisons for the Ganges (4-day lead-time) hydrologic lumped model hydrologic distributed model Resultant Hydrologic multi-model
Multi-Model Forecast Regression Coefficients - Lumped model (red) - Distributed model (blue) • Significant catchment variation • Coefficients vary with the forecast lead-time • Representative of the each basin’s hydrology -- Ganges slower time-scale response -- Brahmaputra “flashier”
Significance of Weather Forecast Uncertainty Discharge Forecasts Precipitation Forecasts Discharge Forecasts 1 day 4 day 1 day 4 day 3 day 4 day 10 day 7 day 7 day 10 day
1 PDF Step 1: generate discharge ensembles from precipitation forecast ensembles (Qp): Probability 1/51 Qp [m3/s] Step 2: a) generate multi-model hindcast error time-series using precip estimates; b) conditionally sample and weight to produce empirical forecasted error PDF: a) 1000 forecast horizon b) 1 Residuals PDF [m3/s] time => Residual [m3/s] -1000 1000 -1000 1 Step 3: combine both uncertainty PDF’s to generate a “new-and-improved” more complete PDF for forecasting (Qf): Probability Qf [m3/s] Producing a Reliable Probabilistic Discharge Forecast
Significance of Weather Forecast Uncertainty Discharge Forecasts 2004 Brahmaputra Discharge Forecast Ensembles Corrected Forecast Ensembles 7 day 8 day 7 day 8 day 3 day 4 day 5 day 9 day 10 day 9 day 10 day
2004 Brahmaputra Forecast Results 2 day Above-Critical-Level Cumulative Probability Confidence Intervals Critical Q black dash 50% 95% 7 day 8 day 7 day 8 day 3 day 4 day 5 day 9 day 10 day 9 day 10 day
Overview: Bangladesh flood forecasting CFAB History -- sea-level backwater effects II. 1-10 day Discharge Forecasting 1. precipitation forecast bias removal 2. multi-model river forecasting 3. accounting for all error: weather and hydrologic errors III. 2007 Floods and Warning System Pilot Areas
Five Pilot Sites chosen in 2006 consultation workshops based on biophysical, social criteria: Rajpur Union -- 16 sq km -- 16,000 pop. Uria Union -- 23 sq km -- 14,000 pop. Kaijuri Union -- 45 sq km -- 53,000 pop. Bhekra Union -- 11 sq km -- 9,000 pop. Gazirtek Union -- 32 sq km -- 23,000 pop.
5.2 July/August 2007 floods in Bangladesh “Seven people had died and thousands have been forced to leave their homes in Bangladesh because of worsening floods. Officials said that nearly half a million people remained marooned in seven flood-hit districts in the country's north west and in the south.” (8 August 2007, from http://news.bbc.co.uk).
2007 Brahmaputra Ensemble Forecasts and Danger Level Probabilities 7-10 day Ensemble Forecasts 7-10 day Danger Levels 7 day 8 day 7 day 8 day 9 day 10 day 9 day 10 day
5.2 2007 floods in Bangladesh – fcs for 24/07-26/07 The right figure shows the 144/192h (left) and 192/240h (right) fc probabilities of 48h-accumulated rainfall in excess of 40 (top) and 80 (bottom) mm (CI 5/10/20/30/40/60/110%). The left 1-panel figure shows a 0/48h TL399L91 forecast (CI 25/40/80/160/320mm). PR(TP48>40mm) – 144/192h PR(TP48>40mm) – 192/240h TL399L91 – 0/48h PR(TP48>80mm) – 144/192h PR(TP48>80mm) – 192/240h
Community level decision responses for 2007 flood forecasts (High lands) • Protected homestead vegetables by creating adequate drainage facilities • Livestock was protected in high lands with additional dry fodder (paddy straw) • Early harvesting of B.aman rice and jute anticipating floods in Gaibandha and Sirajganj, respectively. Selvaraju (ADPC)
Community level decision responses for 2007 flood forecasts (Low lands) • Secured cattle, poultry birds, homestead vegetables, protected fishery by putting nets in advance • Planed to evacuate and identified high grounds with adequate communication and sanitation facilities
Community level decision responses for 2007 flood forecasts (Low lands) “… on 25th July we started communicating the information to as many people as possible … especially those people living in river islands (“chars”)...” “On the 28th and 29th, meetings were organized in villages near Rangpur … they perceived that the river water level would fall, but our forecasts showed a rising trend…[with] significant chance of overflow and breaches [of weak] embankments ... We engaged … an evacuation plan urgently” “We communicated the forecast to another pilot union … on July 26th … to mobilize resources for evacuation ... All the six villages in the union were later flooded to a height of 4-6 feet on July 29th… about 35% of the people in the union were evacuated in advance.” “The communities in Rajpur Union … were able to use the forecast for … mobilizing food, safe drinking water for a week to 10 days, protecting their … rice seedlings, fishing nets, and … fish pods.”
Conclusions • 2003: CFAB forecast went operational • 2004: -- Multimodel Forecasts fully-automated -- CFAB became an entity of Bangladesh government -- forecasted severe Brahmaputra flooding event • 2006: -- Forecasts incorporated into operational FFWC model -- 5 pilot study dissemination areas trained • 2007: 5 pilot areas warned many days in-advance during two severe flooding events • 2008-2009: • Ongoing expansion of the warning system • Ongoing technological improvements
However, however, effects of aerosols could be important => Black carbon has caused decreased monsoon rainfall in 20th century