Risk Assessment Basics
Risk Assessment Basics. Content Developed by Steve Pardue, Antares Planning Group, LLC Amended by Caroline Cunningham, AICP Stantec. Natural Hazard Mitigation Association. Purpose of Module. Explain the basics of risk assessment Highlight uses as a decision-making tool

Risk Assessment Basics
E N D
Presentation Transcript
Risk Assessment Basics Content Developed by Steve Pardue, Antares Planning Group, LLC Amended by Caroline Cunningham, AICP Stantec Natural Hazard Mitigation Association
Purpose of Module • Explain the basics of risk assessment • Highlight uses as a decision-making tool • Provide resources, including documents and tools
Learning Objectives • Explain why risk assessment is an essential element in Disaster Risk Reduction decision-making processes • Identify the categories of risk • Define risk in terms of probability, vulnerability, and value • Explain the role of benefit-cost analysis (BCA) in risk assessment
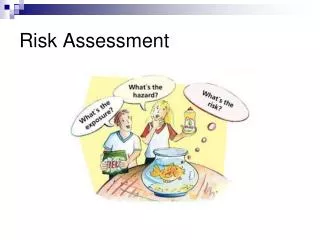
Risk and Risk Assessment How do you define Risk? What is Risk Assessment?
Risk and Risk Assessment How do you define Risk? • Risk is the future effects of an event or series of events on a community What is Risk Assessment? • In the context of natural hazards, risk assessment means organizing and counting future effects of an event or series of events on a community
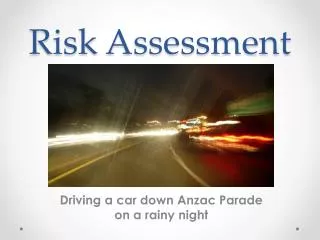
How Can We Solve the Problem of Inaccurate Perceptions of Risk? • Formal risk assessments provide a structure for understanding potential damages (the risk) • Structured risk assessment helps to tune out subjective things and focus on information that can be measured and characterized
Risk Assessment Source: Ready.gov
How are Risk Assessments Used? • Traditional • Businesses/operations • Healthcare • Non-traditional • Company Siting • Politics
Some Reasons for Performing Natural Hazard Risk Assessment • Comparing Effects • Single hazard on different elements in a community • Different hazards on one element • Prioritizing mitigation alternatives • Characterizing the effects of hazards in common terms (standard language) • Resource allocation
A Definition of Risk Risk = Probability X Vulnerability X Value
“Proving” the Value of a Project A project must: • Return more in cost savings over its expected life than it costs initially • Be appropriate to the disaster damage • Prevent future similar damage • Be directly related to the eligible damaged elements • Not increase risks or cause adverse effects to the property or elsewhere
BCAs = Two Comparative Risk Assessments Divided by Cost • FEMA uses BCA to fulfill the Stafford Act requirement • Except for the Pre-Disaster Mitigation Grant Program (PDM), FEMA generally does not use BCA results to prioritize projects
Monetize Risk $$$ • The most common standard for conveying risk is in terms of money • This enables us to compare risks for different kinds of things that can be damaged
The Uncertainty Question Well, you know there are some things that you can’t quantify, so what’s the purpose of going through all this?
Risk Assessment Is Not Perfect “Democracy is the worst form of government, except all the others” – Attributed to Winston Churchill
Reliability and Consistency • Reliable data is crucial to the accuracy of risk assessment • It is important to explain any weaknesses in information to decision makers
What is Probability? Risk = Probability X Vulnerability X Value • Probability is defined as the likelihood some specific event will happen in a particular span of time
Probability: The Most Common Example FIRM section generated for Gainesville, Florida using the FEMA Flood Map Service Center
However… Flood Profile, FEMA MSC
Flood Profile Graph: A Closer Look Flood Profile: Santa Fe River, Gainesville, FL; FEMA Flood Map Service Center
Flood Profile Graph: A Closer Look (2) Flood Profile
FEMA Risk MAP Flood Risk Products FEMA MSC
Probabilities – What are They and What are the Limitations? Risk = Probability X Vulnerability X Value • Probability of changing environment – predictable? • Example: Sea level rise (SLR) • New York City Panel on Climate Change (NPCC2) • National Oceanic and Atmospheric Administration (NOAA) – Digital Coast
What is Vulnerability? Risk = Probability X Vulnerability X Value • Vulnerability is simply the degree of damage that occurs when something is exposed to (in this case) a natural hazard
Vulnerability – Example 1 Photos: FEMA.gov
Vulnerability – Example 1 (cont.) Photo: FEMA.gov
Vulnerability – Example 3 Photos: FEMA.gov
How is Vulnerability Characterized and Quantified? Risk = Probability X Vulnerability X Value • At least in the context of risk assessment, vulnerability is described in terms of impacts and losses
Examples of Tools for Analyzing and Quantifying Vulnerability • FEMA’s Hazus-MH • Rapid Visual Screening of Buildings for Potential Seismic Hazards • Integrated Hazards Assessment Tool (IHAT) (Best Practices link) • Stantec’s Mitigation Benefits Estimator
What is Value and How is It Determined? Risk = Probability X Vulnerability X Value
Value: Life Risk = Probability X Vulnerability X Value • The Federal Aviation Administration (FAA) and other organizations (insurance companies) develop specific values for life/injury
Value: Life (cont’d) TREATMENT OF THE VALUES OF LIFE AND INJURY IN ECONOMIC ANALYSIS (Federal Aviation Administration) AIS - Abbreviated Injury Scale VSL – Value of a Statistical Life Treatment of the Values of Life and Injury in Economic Analysis
Value: Life (cont.) Risk = Probability X Vulnerability X Value • FEMA’s approach and current year values are discussed in Standard Economic Values guidance • Guidelines and Discount Rates for Benefit-Cost Analysis of Federal Programs (Circular A-94, Revised)
Value: Physical Elements Risk = Probability X Vulnerability X Value • Wide range of elements and ways to find values • Examples • Buildings – Building Replacement Value (BRV), Materials and Structures (M&S) • Contents (FEMA defaults) • Roads and infrastructure (engineering resources) • Environment, habitat, etc.
Value: Loss of Function (1) Risk = Probability X Vulnerability X Value • Functions include: • Services • Businesses • “Infrastructure” like roads and utilities
Value: Loss of Function (2) How loss of function is counted varies by the function itself • Public services – “proxy” value – willingness to pay • Private sector – revenue (profit) • Roads – detour distance and time • Water – (FEMA) fixed value X number of customers • Sewage treatment – (FEMA) fixed value X number of customers • Electric power – (FEMA) fixed value X number of customers
Value: Loss of Function (3) How loss of function is counted varies by the function itself • Hospitals – algorithm incorporates deaths and population served (complex) • Police - algorithm incorporates changes in crime and population served (complex) • Fire - algorithm incorporates changes in fire damage and population served (complex) • Emergency Medical Services (EMS) - algorithm incorporates avoided deaths and injuries and population served (complex)
Value: Loss of Function (4) Risk = Probability X Vulnerability X Value Risk assessments may also include enjoyment and health benefits • US Army Corps of Engineers (USACE) assesses (flood) risks and the benefits of recreation and tourism • US Environmental Protection Agency (EPA) counts damages from water and air pollution • National Institute of Building SciencesNatural Hazard Mitigation Saves: 2017 Interim Report also includes societal benefits when determining value
Methodologies and Tools for Risk Assessment • Many different, but conceptually related, approaches • Varying degrees of subjectivity and objectivity • Point is always the same: try to characterize potential losses • Very wide range of things that can be counted as risks • Data sources and tools available on FEMA’s Hazard Identification and Risk Assessment web page
FEMA BCA Software, Guidance, and Methodology • FEMA Benefit Cost Analysis • BCA Toolkit current version • System requirements • BCA Helpline 1-855-540-6744 bchelpline@fema.dhs.gov • Training – search Benefit Cost Analysis at Emergency Management Institute (EMI)
Mitigation Benefits Estimator (MBE) & Recap • Flood Hazard • At risk structures – multiple frequencies
MBE & Recap • Dollar loss • 100-yr • All frequencies annualized
MBE & Recap (cont.) • Mitigation Project Costs