Download
1 / 32
320 likes | 353 Vues
Explore the shared values, beliefs, and behaviors shaping Texas politics and government, from classic liberalism to social conservatism, and the unique Texas individualism. Learn about the economy of Texas and the diverse population influencing its political culture.

E N D
Political Culture of Texas The Ideological and Socioeconomic Context of TexasPolitics and Government • Political Culture • Political Ideology and Socialization • The Economy of Texas • The People of Texas
Political Culture • Political Culture is a people’s shared framework of values, beliefs, and habits of behavior related to government politics. • Relationship between government and people • Rights and responsibility of people • Obligations of government • Limits on government authority
Political Culture and Political Ideology • Political ideology is a consistent set of beliefs and attitudes concerning the scope and purpose of government. • Texas political ideology is described in terms of three different ideals • Classic liberalism • Social conservatism • Populism • Overlapping focus results in low taxes and low government service in Texas,
Texas Individualism • Product of 17th Century Anglo/European Protestantism. • Society based on land ($.125 per acre). • Frontier setting lasts four decades. • Conflict with Native Americans. • Adaptation: • Ranching for agriculture • Texas cowboy (vaquero) • Texas Ranger
Classic Liberalism • Thomas Jefferson and James Madison • Individualism – as long as rights of others are not restricted. • Opposed to government control to attain social objectives. • Religious tolerance and protection of civil liberties. • Reliance on “Laissez faire” – free market economy.
Social Conservatism • John Adams and Alexander Hamilton • Embrace traditional hierarchical social relations. • View social change as a threat to established practices and beliefs. • Accept use of government to reinforce traditions.
Populism • Primarily concerned with protecting the ordinary people. • Stresses use of government to regulate both society and the economy. • Conflicting approaches • Government regulation to aid farmers • Lower taxes on middle and upper classes.
Contemporary Liberals • Promote use of government to economic, political and social equality. • Leaves individual free to make moral or personal decisions without government influence. • Has its roots in Franklin Roosevelt’s “New Deal” and Lyndon Johnson’s “Great Society”.
One Dimensional Political Spectrum Center Right Wing Left Wing Radical Liberal Moderate Conservative Reactionary Status Quo
Four Texas Ideologies Equality Results • Populism • Liberalism Equality Opportunity • Libertarianism • Conservatism Individualism Liberty Ordered Liberty
David Nolan Ideology GraphLibertarian Expansion to 3 Dimensions
Acquisition of Political Ideas • General Socialization – learning manners and proper etiquette. • Political Socialization - learning political values and beliefs. • “Texans are made not born!” • Agents of Political Socialization • Family • School • Religion • Media
Family Influence • Identification with: • Ethnicity • Race • Religion • Class • Has to be successfully articulated by parents, understood by children and perceived as important.
School Influence • Introduction of substance as well as different, contradictory points of view. • More important in Texas than in other states. (Alamo vs Bunker Hill)
Influence of Religion • Provide a significant part of a society’s value infrastructure. • Disagreements over religious doctrine and public policy. • Abortion • Rights of women • Rights of Gays and Lesbians
Media Influence • For adults the principal agent is the mass media. • Includes printed material, broadcast news, on-line services, and various entertainment media. • Television by far the most influential, 53% of the population consider it their source of events. • Can be manipulated by the journalist or producer/director.
The Texas Economy • Cotton - Heart of the early economy • First real economy but gave way to cattle after the civil war. • Cattle - Continuation of Mexican free range steers/cattle • Oil - 20th century growth industry until late 1940. Cheaper to import oil. 1973 embargo and boom. Crash in mid 1980s. • Diversification – manufacturing, technology and services.
Economic Ideals and Concerns • Entrepreneurship • Creation of Wealth • Aversion to Taxation • Aversion to Government Services • Importance of Public Education
Texas Social Workforce • 60% Anglo • 25% Hispanic • 12% African American • 2% Asian American • 1% Native American
Texas Economy Today • Diversification, nationalization and globalization • Agriculture $13 Billion • 1/3 crops 2/3 cattle • Oil/Gas Production • 1935 375,617M barrels, 59,461 wells • 1978 1billion barrels, 166,365 wells • 2003 357,580M barrels, 153,461 wells • 2005 376,709M barrels, 150, 856 wells • 2008 ProductionWells • 30% growth in manufacturing • 84% growth in services • 200% growth in exports • GSP 2007 - $1 Trillion
Texas Wealth and Poverty • Texas ranks 3rd in U.S. income inequality • Texas ranks 40th in high school graduates • Ethnic Poverty rates: • Anglo 8% • Hispanic 25% • African American 23% • Primarily in urban areas and Rio Grande Valley
The People of Texas23,507,783 (2006) • Native Americans • Hispanics (4000) • African Americans (5000) • Asian Americans • Anglos (31000)
Population Growth • Since 2000 Census – 2,000,000 • 1,200,000 – Texan Births – Deaths • 800,000 – Immigration • 200,000 – national immigrants • 600,000 – international immigrants
Population Distribution • 1850 – 3.5% urban (2500+ cities) • 1900 – 17.1% • 1950 – 60% • 2000 – 85%
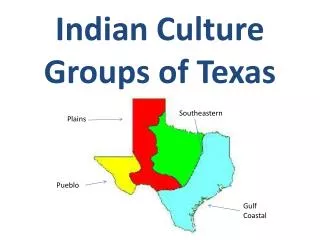
Native Americans ( .7%) • North - Lippan Apaches, Wichitas • East - Caddos “Tayshas” • Central - Tonkawas, Wacos • South – Coahuiltecan, Karankawas • West - Comanche, Apaches, Jumanos • Today there are 3 tribes • Alabama-Coushattas • Kickapoos • Tiguas (1990s - Speaking Rock Casino)
Hispanics (35.1%) • Spanish Rule 1535 - 1821 (Dies y Seis) • Mexican Rule 1821 - 1836 • Republic of Texas 1836 - 1845 (10%) • State of Texas • 1850 Census made up 7% of population • 1890 Census made up 4% of population • 1910 10 fold growth in population • 1940 made up 20% of population • 2000 made up 32% of population • Held 2000 elected political offices in 2003 • 98% of these officials are Democrats
African Americans ( 11.7%) • Mexican government opposed slavery • 1836 made up 12.5% of population • 1836 to 1865 forced migration with southern farmers, made up 33% of population. • Agricultural changes from plantations to share croppers to tenant/owner farmers causes drop in population to 12%. • Held 460 elected offices in 2001. • 9th in U.S. in number elected in state and local government.
Asian Americans (3.3%) • 1869 Chinese • 1903 Japanese • 1970 Vietnamese • Also represented - Koreans, Filipinos, Indians • Limited participation at the county or city level in elected office.
Anglos (49.1%) • Early Settlement 1815 -1821 • US immigrants from upper southern states • European immigrants • Mexican Empresario Program 1821 - 1835 • US immigrants from lower southern states • European immigration continues • 1836 Anglo Population • 60% Upper Southern US 10% New England • 25% Lower Southern US 5% European