Stellar Temperatures
Stellar Temperatures. Wien’s law works perfectly for objects with Planck spectra. Stars don’t quite have Planck-like spectra. 10,000k `blackbody’ spectrum. 10,000k stellar spectrum. Int. UV Blue Green Red Infrared.

Stellar Temperatures
E N D
Presentation Transcript
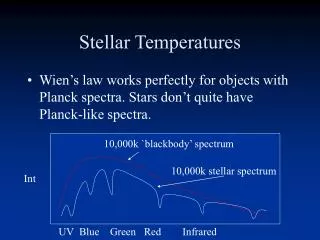
Stellar Temperatures • Wien’s law works perfectly for objects with Planck spectra. Stars don’t quite have Planck-like spectra. 10,000k `blackbody’ spectrum 10,000k stellar spectrum Int UV Blue Green Red Infrared
Star colors have been calibrated to temperature, but lose sensitivity above about 12000K when using visible-light colors.
Stellar Temperatures • Another problem with using colors is that there is dust between the stars. The dust particles are very small and have the property that they scatter blue light more efficiently than red light. This is called `interstellar reddening’. • Most stars appear to be REDDER than they really are (cooler) • Stars of a given luminosity appear FAINTER than you would calculate given their distance and the inverse square law.
Stellar Temperatures • Despite these complications, we often use colors to estimate stellar temperatures, but there can be confusion. • Fortunately, there is another way to estimate stellar temperatures which also turns out to be the answer to a mystery that arose as the first spectra of stars were obtained. • Stellar spectral types
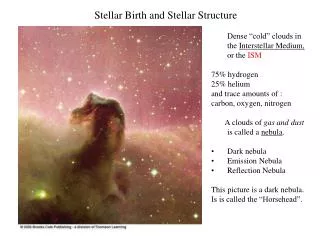
Spectral Types • Long ago it was realized that different stars had dramatically different absorption lines in their spectra. Some had very strong absorption due to hydrogen, some had no absorption due to hydrogen, some were in between. • With no knowledge of the cause, stars were classified based on the strength of the hydrogen lines in absorption: A star -- strongest H lines B star -- next strongest and so on (although many letters were skipped)
Spectral Types Microsoft `rainbow’ is not astronomically correct… A star spectrum Intensity Wavelength
Spectral Types Intensity G star spectrum Wavelength
Spectral Types • The A stars show only strong absorption lines due to Hydrogen • Other spectral types show weaker H lines and generally lines from other elements. • For M stars, there are also lines from molecules.
Hydrogen lines Note the Difference in Spectral shape H lines at Max strength Molecular lines
Spectral Type Explanation • The different spectral types were recognized in the early 1800s. • Why do some stars show strong absorption due to hydrogen and others don’t. • The obvious solution would be to imagine that it is due to differences in the chemical composition of stars. Nope!
Spectral Type Explanation • Think about how absorption lines are produced. Hydrogen lines in the visible part of the spectrum (known as the Balmer Series) are created when a photon is absorbed by bouncing an electron from the 1st excited level to a higher excited level. • Photons with just the right energy to move an electron from the 1st excited state to the 2nd excited state have a wavelength of 636.5nm. This is in the red part of the spectrum and this absorption line is called
Hydrogen atom energy level diagram 3rd ground 2nd 1st 1st + 486.1nm photon Absorbed, e- jumps From 1st to 3rd Excited level 636.5nm photon Absorbed and e- in 1st excited state Jumps to 2nd excited level
For one of the visible-light transitions to happen, there must be some H atoms in the gas with their electrons in the 1st excited state.
Hydrogen Line formation • Imagine a star with a relatively cool (4000k) atmosphere. Temperature is just a measure of the average velocity of the atoms and molecules in a gas. For a relatively cool gas there are: (1) Few atomic collisions with enough energy to knock electrons up to the 1st excited state so the majority of the H atoms are in the ground state (2) Few opportunities for the H atoms to catch photons from the Balmer line series. So, even if there is lots of Hydrogen, there will be few tell-tale absorptions.
Hydrogen Line Formation • Now think about a hot stellar atmosphere (say 40000k). Here the collisions in the gas are energetic enough to ionize the H atoms. • Again, even if there is lots of hydrogen, if there are few H atoms with electrons in the 1st excited state, there will be no evidence for the hydrogen in the visible light spectrum.
Therefore, the spectral sequence is a result of stars having different Temperature.
Wien’s Law Tells you these Are hot. Spectrum Peaking at short wavelengths OBAFGKM Too hot Just right Moving down The sequence The wavelength Of the peak of The spectrum Moves redward Too cold Only see molecules in cool gases
Given the temperature of a gas, it is possible to calculate the fraction of atoms with electrons in any excitation level using an equation called the Boltzmann Equation.
It is also possible to calculate the fraction of atoms in a gas that are ionized at any temperature using an equation called the Saha Equation. • The combination of Boltzmann and Saha equations and hydrogen line strength allow a very accurate determination of stellar temperature.
Spectral Sequence • Temperature effects are far and away the most important factor determining spectral types. Once this was recognized, the sequence was reorganized by temperature. Hottest Sun coolest O5 O8 B0 B8 A0 A5 F0 F5 G0 G5 K0 K5 M0 H lines weak Because most atoms Have e- in the ground State. H lines weak Because of ionization H lines a max strength
Spectral Sequence • There are some additional spectral types added - L and T are extremely cool stars; R, N and S for some other special cases. The usual sequence is OBAFGKMRNS and there are some awful mnemonic devices to remember the temperature sequence.
OBAFGKMRNS • Oh Be A Fine Girl Kiss Me
OBAFGKMRNS • Oh Be A Fine Girl Kiss Me • Oh Bother, Another F is Going to Kill Me
OBAFGKMRNS • Oh Be A Fine Girl Kiss Me • Oh Bother, Another F is Going to Kill Me • Old Boring Astronomers Find Great Kicks Mightily Regaling Napping Students
OBAFGKMRNS • Oh Be A Fine Girl Kiss Me • Oh Bother, Another F is Going to Kill Me • Old Boring Astronomers Find Great Kicks Mightily Regaling Napping Students • Obese Balding Astronomers Found Guilty Killing Many Reluctant Nonscience Students
OBAFGKMRNS • Oh Backward Astronomer, Forget Geocentricity; Kepler’s Motions Reveal Nature’s Simplicity
OBAFGKMRNS • Oh Backward Astronomer, Forget Geocentricity; Kepler’s Motions Reveal Nature’s Simplicity • Out Beyond Andromeda, Fiery Gases Kindle Many Radiant New Stars
OBAFGKMRNS • Oh Backward Astronomer, Forget Geocentricity; Kepler’s Motions Reveal Nature’s Simplicity • Out Beyond Andromeda, Fiery Gases Kindle Many Radiant New Stars • Only Bungling Astronomers Forget Generally Known Mnemonics
Hydrogen lines Note the Difference in Spectral shape H lines at Max strength Molecular lines
Spectral Sequence • Temperature effects are far and away the most important factor determining spectral types. Once this was recognized, the sequence was reorganized by temperature. Hottest Sun coolest O5 O8 B0 B8 A0 A5 F0 F5 G0 G5 K0 K5 M0 H lines weak Because most atoms Have e- in the ground State. H lines weak Because of ionization H lines a max strength