Introduction to Spectrophotometry
270 likes | 1.18k Vues
Introduction to Spectrophotometry. Properties of Light. Electromagnetic radiation moves in waves. Electromagnetic Spectrum. Electromagnetic Spectrum. Colors & Wavelengths. Visible Light. What is Colorimetry?. The solutions of many compounds have characteristic colors.

Introduction to Spectrophotometry
E N D
Presentation Transcript
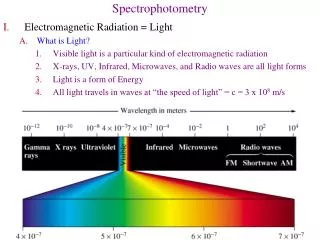
Properties of Light • Electromagnetic radiation moves in waves
Colors & Wavelengths Visible Light
What is Colorimetry? • The solutions of many compounds have characteristic colors. • The intensity of such a color is proportional to the concentration of the compound.
What are Spectroscopy and Spectrophotometry?? • Light can either be transmitted or absorbed by dissolved substances • Presence & concentration of dissolved substances is analyzed by passing light through the sample • Spectroscopes measure electromagnetic emission • Spectrophotometers measure electromagnetic absorption
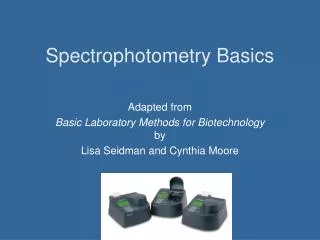
Instruments of Measurement • Two most common: • Visible Spectrophotometer • Spect 20, Spect 88 • Atomic-Absorption Spectrophotometer
Instruments of Measurement • What do visible spectrophotometers measure? • Amount of light absorbed by the dissolved substance • Qualitative • Quantitative
Absorption of Light • White light • All colors • Polychromatic light
Absorption of Light • Monochromatic light • Light of one color Red light is absorbed by the green solution
Definitions & Symbols • Intensity (I) • Transmittance (T) • It’s also referred to as %T or T x 100 • T = I/Io • Where Io is the intensity of the blank
Graphical Relationship • % transmission and % absorption are not linearly related to concentration • For a graph to be useful, a straight line is needed • ABSORBANCE = log(1/T) = -log(T)
Beer’s Law • The intensity of a ray of monochromatic light decreases exponentially as the concentration of the absorbing medium increases. • More dissolved substance = more absorption and less transmittance
Absorbance Beer-Lambert Law(a.k.a. Beer's law) - the linear relationship between absorbance and concentration of an absorbing species. A = lc A is the absorbance “” is molar absorptivity in L/[(mole)(cm)] Also called “extinction coefficient” or “”; it is dependent on the material being studied. “l” is the path length in cm The diameter of the cuvette or sample holder which is the distance the light travels through the absorbing sample. “b” is a constant when the same size cuvette is used for all samples. “c” is the concentration of the sample in (mol/L) Main use of Beer’s Law is to determine the concentration of various solutions.
Transmittance is Related to Absorbance Transmittance is given by the equation: T = I/Io where I is the intensity of the light after it has gone through the sample & Io is the initial light intensity. Absorbance is related to the %T: A = -logT = -log(I/ Io)
Equation Summary T= (I/Io) = 10-A %T = (I/Io) x 100 A = -logT = log(1/T) Sample Calculation If %T = 95%, then A = log(100/95) = log(1/.95) = -log(.95) A = 0.02227 Note the scale for Absorbance: 9/10th of the scale is from 0-1 and 1/10th is from 1-2. For this reason, the spectrometers have been calibrated in % Transmittance and all readings will be taken in %Transmittance.
Spectral Transmission Curve • Optimum wavelength
Standardization Graph • Standards (solutions of known concentration) of the compound of interest are made, treated, and their absorbances (ABS) and concentration values are used to create a Standardization Graph.
Finding the unknown • Suppose this graph is generated • The unknown absorbance is 0.500 • Find 0.500 absorbance • Across and down • The concentration is 0.775 (or so)