Spectrophotometry
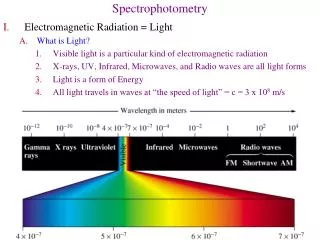
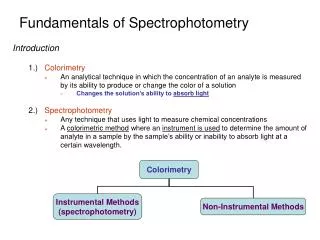
Spectrophotometry. Let There Be Light Spectrophotometry: the use of electromagnetic radiation to measure chemical concentrations. The Ozone Hole. UV absorption. Properties of light -1. 1) 2) Electromagnetic Spectrum 3) Absorption vs Emission of light. change of spin NMR EPR.

Spectrophotometry
E N D
Presentation Transcript
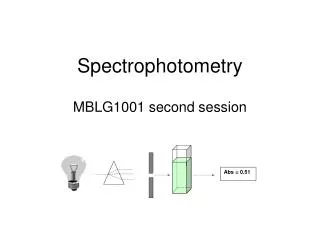
Spectrophotometry Let There Be Light Spectrophotometry: the use of electromagnetic radiation to measure chemical concentrations
The Ozone Hole UVabsorption
Properties of light -1 1) 2) Electromagnetic Spectrum 3) Absorption vs Emission of light
change of spinNMR EPR change of nuclear configurationγ-ray change of e distribution X-ray uv.vis change of configuration IR change of orientationmicrowave
Spectrophotometer Absorption of light -1
Absorption of light -2 • . When no light is absorbed, P=P0 and A=0
Absorbance is proportional to the concentration of light-absorbance molecules in the sample. • A = bc • : molar absorptivity (M-1cm-1)
Absorption of light -3 (ex) How effective is sunscreen ? at the peak absorbance near 300 nm ? A ~ 0.35 T = 10-A = 10-0.35 = 0.45 = 45% 55% UV-B is absorbed.
Practical Matters -1 1) Sample is usually contained in a cell called a cuvet, which has flat, fused-silica faces. A glass made of SiO2 : Vis. UV. Plastics & ordinary glass: Vis NaCl(s) KCl(s) : IR
Practical Matters -2 2) Good Operating Techniques : a) Cuvets handle: systematic errors/ random errors b) Most accurate at A~ 0.3-2 Too little light : (high A), P is small & hard to measure Too much light : (low A), it is hard to distinguish P from P0
Practical Matters -3 • c) Old vs. new curves • d) Greatest sensitivity: λmax • e) Baseline correction
Using Beer’s Law -1 • (a) Proteins at 280 nm: tyr, phe, trp. • (b) A colorimetric reagent to detect phosphate
Using Beer’s Law -2 Ex.1 : Bezene: find molar absorptivity (e)
Beer’s Law -2 Ex.2 : Nitrite in an aquarium (using a standard curve) 543 nm
Using Beer’s Law -3 (toxic when > 1 ppm) NH3 animals & plant [O] (toxic when > 1 ppm) [O] NO3-
Using Beer’s Law -4 2) Standard Nitrite
Using Beer’s Law -5 from least square (4.4) A = 0.1769 [ppm] + 0.0015
Enzyme-based nitrate Analysis - A Green Idea Cd NO3-NO2- NO3- + NADH + H+ NO2- + NAD+ + H2O Nitrate reductase pH 7 P.408
Spectrophotometry : Instruments & Applications
The Spectrophotometer –1 • Remote sensing of airborne bacteria: Optical fiber coated with antibodies to detect spores of a specific bacterium
The Spectrophotometer -2 Spectrophotometer a) Single-beam b) Double-beam
The Spectrophotometer –4 1) Light source Tungsten lamp: Vis. near IR (320 nm~2500 nm) Deuterium are lamp: UV (200~400 nm) Electric discharge lamp + Hg(g) or Xenon: Vis & UV Globar (silicon carbide rod): IR (5000~200 cm-1) Laser: intense monochromatic sources.
The Spectrophotometer -6 2) Monochromatordisperses light into its component wavelengths and selects a narrow band of wavelengths to pass through the sample
Consists: (1) lenses or mirrors: focus the radiation (2) entrance and exit slits: restrict unwanted and control the spectral purity of radiation. (3) dispersing medium: separate the l of polychromatic radiation from the source. (a) prism and (b) diffraction grating
The Spectrophotometer -7 a. entrance slit b. collimating mirror or lens c. a prism or grating d. focal plane e. exit slit Monochromator
19.1 The Spectrophotometer -10 Choosing the bandwidth: exit slit width Resolution Signal Monochromator • trade-off
The Spectrophotometer -10 Detector : A detector produces an electric signal when it is struck by photons (Convert radiant energy (photons) into an electrical signal). Figure 32 shows that detector response depends on the wavelength of the incident photons. Aphotomultiplier tube (Figure 33) is a very sensitive detector. Ideal detector : high sensitivity, high signal/noise, constant response for λs, and fast response time.
The Spectrophotometer -11 Figure 32: Detector response depends on the λof the incident photons. 3) Detector
The Spectrophotometer -12 Photomultiplier tube: very sensitive detector
Analysis of a mixture -1 Absorbance of a mixture :
Analysis of a mixture -2 Isosbestic points :for rxn: X Y, every spectrum recorded during chemical reaction will cross at the same point. Good evidence for only two principle species in rxn. Ex: HIn In-+ H+
Analysis of a mixture -3 Why isosbestic point?
Ferric nitrilotriacetate [used to avoid Fe(OH)3 ] Spectrophotometric Titrations-2
125 μL ferric nitrilotriancetate 2 mL apotransferrin A = 0.260 A corrected = ? Spectrophotometric Titrations-3 Corrected A for the effect of dilution Corrected A = (Vt / Vi) (observed A) (Beer’s law) The absorbance measured after adding 125 mL of ferric nitrilotriacetate to 2.000 mL of apotransferrin was 0.260. Calculate the coorected absorance that should be plotted in Fig 38.
What happens when a molecule absorbs light ? Absorbing species : M + hν M*(lifetime : 10-8 ~ 10-9 sec) Relaxation processes : M* M + heat (most common) M* new species (photochemical reaction) M* M + hn(fluorescence, phosphorescence)
Geometry of formaldehyde Electronic States of Formaldehyde excited state are shown in Figure:
MO of CH2O Molecular orbitals describe the distribution of electrons in a molecule, just as atomic orbitals describe the distribution of electrons in an atom. In Figure, four low-lying orbitals of formaldehyde, labeled σ1 through σ4, are each occupied by a pair of electrons with opposite spin (spin quantum numbers= +1/2 and -1/2 represented by ↑and↓).
Types of absorbing electrons Consider formaldehyde: three types of molecular orbitals
In a electronic transition, an electron moves from one orbital to another. Four types of electronic transitions: σ* π* n E 200~700 nm π 150~250 nm σ < 125 nm
Two possible electronic states arising: n p* transition singlet state: The state in which the spins are opposed. triplet state: spins are parallel E: T1 < S1
Electronic transition of formaldehyde n p* (T1), absorption of light at λ = 397 nm green-yellow n p* (S1), absorption of light at λ = 355 nm colorless (more probable)
Vibration and Rotational States of Formaldehyde The six modes of vibration of formaldehyde. Combined Electronic, Vibrational, and Rotational Transitions Electronic absorption bands are usually very broad (~100 nm) because many different vibrational and rotational levels are excited at slightly different energies.
Vibrational & Rotational states of CH3CO (IR and microwave radiation)
7) Luminescence procedures : emission spectrum of M* provides information for qualitative or quantitative analysis. a molecule absorbs light • Photoluminescence : • Fluorescence : S1 S0, no change in electron spin. (< 10-5 s) • Phosphorescence : T1 S0, with a change in electron spin. (10-4~102 s) • Chemiluminescence : Chemical reaction (not initiated by light) release energy in the form of light. ex : firefly.