Spectrophotometry
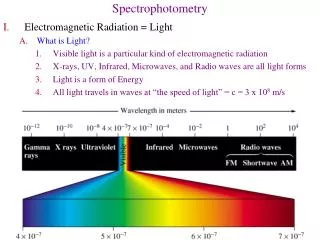
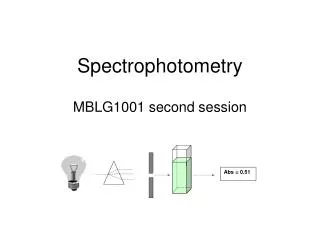
Abs = 0.51. Spectrophotometry. MBLG1001 second session. Before the prac class begins experimental work…. The spectrophotometer actually measures transmittance: %T = (I T /I 0 )*100.

Spectrophotometry
E N D
Presentation Transcript
Abs = 0.51 Spectrophotometry MBLG1001 second session
Before the prac class begins experimental work…. • The spectrophotometer actually measures transmittance: %T = (IT/I0)*100. • This is the intensity of light transmitted through the solution (IT) divided by the intensity of light entering the solution, the incident light (I0). The problem with this measurement is that as the solution becomes more concentrated the %T decreases. The relationship is also not linear. • Absorbance is actually log10I0/IT
Relationship between %Transmittance and light path length and concentration Transmittance = IT/I0 = e-aclwhere a is an extinction constant, c is concentration and l is light path length
Absorbance increases linearly with concentration From IT/I0 = e-acl I have used a here to describe a constant that is proportional to the extinction coefficient. As you can see from the maths it is not the mMolar extinction coefficient taking logs of both sides and inverting Ln (I0/IT) = acl Converting to Log10 Log10(I0/IT) = ecl Hence the Beer-Lambert Law A = ecl
Before the prac class begins experimental work…. • Absorbance increases linearly with concentration as predicted by the Beer-Lambert Law A = ecl • Explain why the working range of a spectrophotometer is 0.1 – 1.0. Remember Abs is a log scale. An absorbance of 1.6 is 2% light transmitted while an absorbance of 2 is 1% light transmitted. The class specs can not accurately distinguish 1% from 2%. An absorbance of 1.0 is 10% transmitted light.
Before the prac class begins experimental work…. • For the mathematically minded: • Transmittance = IT/I0*100 • Absorbance = log10(I0/IT) Converting Transmittance to Absorbance • %T/100 = IT/I0 100/%T = I0/IT Taking logs on both sides • Log 100 – log %T = log I0/IT • 2 – log%T = Absorbance
Before the prac class begins experimental work…. • Going back the other way • Transmittance = IT/I0*100 • Absorbance = log10(I0/IT) Converting Absorbance to Transmittance • Abs = log(I0/IT) • 10Abs = (I0/IT), inverting • 10-Abs = (IT/I0), • 100* 10-Abs = 100*(IT/I0), • 102-Abs = %T
Experiment 1: Identifying a compound by spectrophotometry • If a compound absorbs light its absorption spectrum is a unique property of that compound. • The molecular structure is responsible for the absorption properties • The most common feature of absorbing compounds are conjugated double bonds, often as an aromatic ring
Experiment 1: Identifying a compound by spectrophotometry • Conjugated double bonds result in pi electrons above and below the ring or chain and these electrons can be “moved” to higher levels by photons of light. • As the electrons are promoted to higher levels “allowed” by the molecular structure they absorb light of a specific wavelength, based on the energy required for the transition (DE).
Experiment 1: Identifying a compound by spectrophotometry • This amount of absorbed energy (DE) will determine the l of light absorbed. • The DE is inversely proportional to the wavelength of light absorbed ie. DE = hc/l, where h is Planck’s constant and c is the velocity of light. (Remember this from physics!??)
Common Absorbing Biochemicals • The bases of nucleic acids
The Dyes • The dyes chosen for this experiment are different colours (A – F) • Each pair of students will be assigned a dye by the demonstrator. They use this dye for the whole practical. • Students should take note of the colour of their dye and record the concentration (mM) on the bottle
Obtaining a Spectrum for the dye. • Using the Shimadzu spectrophotometers in spectrum mode (mode 2 on main menu) place a 1 mL plastic cuvette full of H2O in the holder and obtain a baseline correction (F1). This will take some time. • Then, using the same cuvette, fill it with the dye solution and obtain a spectrum. Find the peaks. If you are unclear how to do this practise beforehand.
Obtaining a Spectrum for the dye. • The reason for doing this is to find the absorbing region of the dye. It takes a long time to obtain a spectrum from 600 nm to 350 nm. A quick narrowing of the range is to be encouraged. • Get students to consider the colour of the solution and how this might give clues to the absorption minima and maxima
The relationship between colour and absorption • A compound will be yellow if it reflects light in the yellow wavelengths and absorbs light of other wavelengths. • Yellow compounds (often red crystals) usually absorb in the blue range ~450 – 350 nm and have an absorption minimum >550 nm
Dye C is yellow - red and has an absorption minimum in the yellow/red region Dye C: Riboflavin
Obtaining the spectrum • Once the baseline is corrected and the absorbing range determined, find the absorbance of the dye every 10 nm within the absorbing range. Every 50 nm will do outside the absorbing range. • If the baseline correction is done you don’t have to zero every time you change wavelengths. This saves heaps of time.
Obtaining the spectrum • Students must, by the next lab, plot the spectrum. It would be a good idea to get them to this now if there are free computers. Otherwise get them to identify the dye by the peaks, comparing to the sample spectra at the back of this section of the lab manual. • From the concentration on the bottle estimate the extinction coefficient.
Obtaining the spectrum • Make sure you are very familiar with the Excel chart drawing process as you will need to help the students here. Practise with the spectro.xls spreadsheet provided. It has the raw data obtained for riboflavin and the worked solution. • Check out what is expected graph-wise in the worked solution. Students should have practised much of this with the Excel task in the last practical.
Calculating the Extinction Coefficient • This comes directly from the relationship A = ecl, Where e is the extinction coefficient expressed in the units of c, the concentration. In this experiment the conc units will be mM so e will have the units mM-1cm-1. Round the value off to 1 dec pl.
Discussion • Predict which of the following parameters would change with dilution? How would they change? • The number of peaks • The l max • Al1/Al2 • Absorbance at l max • Extinction Coefficient • Transmittance at lmax • Can you predict what would happen to the absorption spectrum if you diluted your dye with another dye?
Experiment 2: The Standard Curve • Although identifying a compound by spectro is a useful property, spectrophometry is used more often to measure the concentration of a compound. • Sometimes the extinction coefficient can be used directly. This occurs when the compound of interest has an intrinsic absorbance.
Experiment 2: The Standard Curve • If the compound of interest does not have its own intrinsic absorbance then a coloured derivative must be made by reacting it with reagents. Then a standard curve must be produced. • In today’s practical students will gain experience at producing and using a standard curve, even though in this situation you would normally use the extinction coefficient.
Experiment 2: The Standard Curve • Using the same solution as the one used to obtain the spectrum, get the students to dilute it so that there are at least 5 points for the line. My suggestion is 200, 400, 600, 800, 1000 uL of dye, then make each up to 1 mL with water. • Mix well and obtain the absorbances at the lmax.
The standard curve Plot the concentration in nmol/tube or nmol/mL
The standard curve • The main point of confusion in this task is how to plot the concentration. The purists would plot it in mM or uM and this would be correct BUT confusing for the students when they come to back calculate with it. • Instead plot it in nmoles per tube which in this case is nmol/mL. Note that the riboflavin concentration range is ~0 – 80 nmol/mL. It is not “neat” due to the concentration of the starting dye solution 0f 0.0836 mM.
How to use the standard curve • The standard curve is used to find the concentration of an unknown solution of riboflavin. • This practical session has 2 different unknowns the students must determine the concentration of; one which is in the working range of the spectrophotometer or standard curve i.e. 0.1 – 1.0, the other is outside the range.
Unknown 3a • This unknown can be directly determined by measuring its absorbance without dilution. • However it is always good practise to do at least one dilution when estimating a concentration. • The obvious dilution is a 1 in 2 dilution. This is your chance to introduce dilutions to the students.
Dilutions • A 1 in 2 dilution is 1 part riboflavin unknown C1 and 1 part H2O. • If you wanted to make up a 1 in 2 dilution of unknown C1 which could be easily read off the standard curve you would make it up to 1 mL. • This would mean 500 uL of unknown C1 and 500 uL H2O.
From standard curve or using INTERCEPT function in Excel From standard curve or using SLOPE function in Excel [Riboflavin] (nmol/mL) = (A445-intercept)/slope [original] = [riboflavin]*dilution factor Average of 2 values
Quick tips • You can use the extinction coefficient obtained in the first experiment or the standard curve. Get the students to try both methods. • To get from the Absorbance to the concentration you solve the equation of the standard curve for x; you know the y value (Abs) and you want to find out the x value (conc.)
Why we express the concentration in nmol/tube • Provided you make the unknown dilutions to the same volume as the standards you can directly work out how much there is in the tube straight from the graph. • In the next exercise, unknown C2 or C3, it will be a real advantage
Discussion Q from this section • Where does the extinction coefficient fit in to the std curve? • It is the gradient, but the units of the ext. coefficient are in the conc. Units on the x-axis • What would happen to the absorbance response and the equation of the line if: • you measured the absorbance at a wavelength other than the lmax? • It would be linear but the gradient i.e. the ext. coefficient would be lowerSee the varyQ worksheet in the spectro.xls
What would happen to the absorbance response and the equation of the line if: • you expressed the concentration in different units (try M and % (w/v), obtaining the molecular weight of the dye from your demonstrator)? • The equation changes, in particular the gradient. The easiest way is to try this. Use the data given in the spectro spreadsheet. • you made the dye solutions up in 3 mL instead of 1 mL? • No difference, the absorbance is dependent on the concentration, which is volume independent. The only problem is if the cuvette is not full enough to cover light source • you used cuvettes with a 2 cm light path instead of 1 cm? The slope would be double as the absorbance would double for each tube
Experiment 3b: Unknown outside the working range of the spectrophotometer • What concentration of riboflavin gives an absorbance of 0.5? (always aim for the middle of the range) Using A = ecl……0.5 = 12.5*c*1 Conc = 0.04 mM 40 uM 40 nmol/mL • So we need 40 nmoles of riboflavin in 1 mL to get an absorbance of 0.5
Experiment 3b: • Now how much of our unknown do we need to add to give an absorbance of 0.5? • Our unknown, C2, lies between 0.5 and 1 mM. Undiluted this unknown would give an absorbance between 6 and 12…way too high! • So we need to dilute our unknown…but by how much
Experiment 3b: • Let’s consider the upper end of the range, 1 mM. • If our unknown is 1 mM, which is 1 umol/mL or 1 nmol/uL then….. • as we need 40 nmol/mL to give an absorbance of 0.5 so we would need to add 40 uL (40/1).
Experiment 3b: • Then let’s consider the lower end of the range, 0.5 mM. • If our unknown is 0.5 mM, which is 0.5 umol/mL or 0.5 nmol/uL then….. • as we need 40 nmol/mL to give an absorbance of 0.5 so we would need to add 80 uL (40/0.5).
Experiment 3b: • So we need to add between 40 and 80 uL of our unknown and make these up to 1 mL mix well ……. • Then measure the absorbances of our samples. 0.396 0.490 0.594 0.681 0.774
The back calculations • The volume of the unknown (uL) and the A445 are entered in directly as data. • To calculate the [Riboflavin] (nmol/mL) you solve the standard curve equation for x. This gives the #nmoles of riboflavin in each cuvette. 31.76 39.31 47.66 54.65 62.12
31.76 39.31 47.66 54.65 62.12 The back calculations From the [Riboflavin] (nmol/mL) we need to know the concentration in the original unknown C2 ?
40 uL 50 uL 60 uL 70 uL 80 uL The back calculations Each cuvette has a known volume of the original unknown added and we know #nmoles of riboflavin in each cuvette 39.31nmoles 31.76 nmoles 47.66 nmoles 54.65 nmoles 62.12 nmoles
40 uL 50 uL 60 uL 70 uL 80 uL 0.79mM 0.79 mM 0.79 mM 0.78 mM 0.78 mM If we simply divide the #nmoles by the volume added in uL we have the original concentration of the unknown riboflavin in nmol/uL which is mM. After all we only added two solutions to each cuvette; water and riboflavin. We hope the nmoles came from the dye not the water. Average = 0.79 mM
For unknown C3: range 1 – 2 mM • The upper range:2 mM 2 umol/mL 2 nmol/uL • So we need to add 40/2 = 20 uL • The lower range: • 1 mM 1 nmol/uL • So we need 40/1 = 40 uL