Download
1 / 18
180 likes | 559 Vues
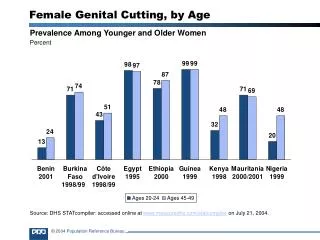
Female Genital Cutting, by Age. Prevalence Among Younger and Older Women Percent . Source: DHS STATcompiler: accessed online at www.measuredhs.com/statcompiler on July 21, 2004. Female Genital Cutting, by Level of Education. Prevalence Among Women 15 to 49 Percent .

E N D
Female Genital Cutting, by Age Prevalence Among Younger and Older Women Percent Source: DHS STATcompiler: accessed online at www.measuredhs.com/statcompiler on July 21, 2004. © 2004 Population Reference Bureau
Female Genital Cutting, by Level of Education Prevalence Among Women 15 to 49 Percent Source: DHS STATcompiler: accessed online at www.measuredhs.com/statcompiler on July 21, 2004. © 2004 Population Reference Bureau
Female Genital Cutting, by Residence Prevalence Among Women 15 to 49 Living in Urban, Rural Areas Percent Source: DHS STATcompiler: accessed online at www.measuredhs.com/statcompiler on July 22, 2004. © 2004 Population Reference Bureau
Age at Marriage, Sub-Saharan African Countries Median Age at First Marriage, Women 20 to 24 at Time of Survey Years Source: DHS STATcompiler: accessed online at www.measuredhs.com/statcompiler on July 22, 2004. © 2004 Population Reference Bureau
Births and Assisted Deliveries Worldwide Births in 2000, and Births Attended by Skilled Personnel 1995-2000 Source: UNICEF End of Decade Databases—Delivery Care (www.childinfo.org/eddb/maternal/index.htm). © 2004 Population Reference Bureau
The areas of the world in which deliveries are least likely to be attended by skilled personnel, South Asia and sub-Saharan Africa, account for nearly half of all births worldwide (37 million and 26 million, respectively, out of a total of 132 million in 2000). Notes on Births and Assisted Deliveries Worldwide
Birth Spacing, Less Developed Countries Births, by Interval Percent of all births Source: DHS STATcompiler: accessed online at www.measuredhs.com/statcompiler on July 22, 2004. © 2004 Population Reference Bureau
Causes of Maternal Mortality Pregnancy and Childbirth-Related Deaths to Women, by Cause, 1997 Note: Total exceeds 100 percent due to rounding. Source: World Health Organization, Reduction of Maternal Mortality: A Joint WHO/UNFPA/UNICEF/World Bank Statement, Geneva, 1999. © 2004 Population Reference Bureau
Nearly three-quarters of maternal deaths are due to direct complications of pregnancy and childbirth, such as severe bleeding, infection, unsafe abortion, hypertensive disorders (eclampsia), and obstructed labor. Women also die of indirect causes aggravated by pregnancy, such as malaria, diabetes, hepatitis, and anemia. Notes on Causes of Maternal Mortality
Lifetime Risks to Mothers Lifetime Risks to Mothers Risk of Dying of Maternal Causes or of Losing a Newborn* Percent chance * Deaths to babies between birth and 28 days. Note: Based on most recent available rates. Source: Save the Children and Population Reference Bureau, Healthy Mothers and Healthy Newborns: The Vital Link, April 2002; and UNFPA, Maternal Mortality in 2000: Estimates Developed by WHO, UNICEF and UNFPA, 2003. © 2004 Population Reference Bureau
Maternal Deaths per 100,000 Live Births 2000 Source: WHO, UNICEF, and UNFPA, Maternal Mortality in 2000: Estimates Developed by WHO, UNICEF, and UNFPA, 2003. © 2004 Population Reference Bureau
Maternal Mortality, by Region Maternal Mortality, by Region 2000 Estimates Pregnancy and childbirth-related deaths per 100,000 live births Source: UNICEF, Maternal Mortality in 2000: Estimates Developed by WHO, UNICEF, and UNFPA, 2003. © 2004 Population Reference Bureau
Notes on Maternal Mortality, by Region Over 99 percent of maternal deaths occur in less developed countries, particularly in Asia and Africa. While high-quality, accessible health care has made maternal death a rare event in more developed countries, the lack of such health care has fatal consequences for pregnant women in less developed countries.
Skilled Care at Delivery and Maternal Deaths Regional Comparisons, 1995-2000 Sub-Saharan Africa South Asia Middle East and North Africa Latin America/ Caribbean East Asia and Pacific Central, Eastern Europe/ Baltics/ CIS* * Commonwealth of Independent States (former Soviet Union). Source: UNICEF End of Decade Databases—Delivery Care (www.childinfo.org/eddb/maternal/index.htm); and Maternal Mortality in 2000: Estimates Developed by WHO, UNICEF, and UNFPA, 2004. © 2004 Population Reference Bureau
Awareness of STIs Respondents With Symptoms Who Sought Treatment, by Sex Percent Note: The figure presents the percentage of respondents who reported symptoms suggestive of STIs in the last 12 months who sought care at a service provider with personnel trained in STI care. Source: DHS HIV/AIDS Survey Indicators Database: accessed online at www.measuredhs.com/statcompiler on July 26, 2004. © 2004 Population Reference Bureau
Treatment-seeking for a sexually transmitted infection is a measure of knowledge of infections such as syphilis, gonorrhea, and chlamydia—knowledge of the symptoms and knowledge that they require prompt medical treatment. Symptoms typically appear early in males, whereas STIs are less likely to produce symptoms in women and are therefore more difficult to diagnose until serious problems develop. STIs cause long-term health complications. For example, the association between human papillomavirus and cervical cancer is well established. STIs are one of the most important preventable causes of low birth weight/prematurity, congenital infection, stillbirth, and postpartum infection. Notes on Awareness of STIs
Cervical Cancer in the Americas Estimates for Late 1990s Rates per 100,000 women Note: Rates are age-standardized, meaning they permit international comparison in spite of varying age structures. Source: J. Ferlay et al., International Agency for Research on Cancer, World Health Organization, GLOBOCAN 2000 Database, 2001. © 2004 Population Reference Bureau
Cervical Cancer, by World Region Estimates for Late 1990s Rates per 100,000 women Note: Rates are age-standardized, meaning they permit international comparison in spite of varying age structures. Source: J. Ferlay et al., International Agency for Research on Cancer, World Health Organization, GLOBOCAN 2000 Database, 2001. © 2004 Population Reference Bureau