Download
1 / 26
260 likes | 501 Vues
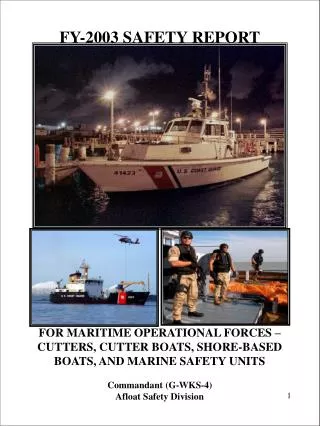
FY-2003 SAFETY REPORT. FOR MARITIME OPERATIONAL FORCES – CUTTERS, CUTTER BOATS, SHORE-BASED BOATS, AND MARINE SAFETY UNITS Commandant (G-WKS-4) Afloat Safety Division. TABLE OF CONTENTS. Why This Report? pg 3 Message from Chief of Afloat & Marine Safety pg 4 Cutters pg 5

E N D
FY-2003 SAFETY REPORT FOR MARITIME OPERATIONAL FORCES – CUTTERS, CUTTER BOATS, SHORE-BASED BOATS, AND MARINE SAFETY UNITS Commandant (G-WKS-4) Afloat Safety Division
TABLE OF CONTENTS Why This Report? pg 3 Message from Chief of Afloat & Marine Safety pg 4 Cutters pg 5 Cutter-based Boats pg 11 Shore-Based Boats pg 12 Marine Safety Activities pg 17 Team Coordination Training (TCT) pg 20 History of Afloat Class A&B Mishaps pg 23 Common Mishap Discrepancies pg 25 Contact Info pg 26
COAST GUARD CUTTERS & CUTTER-BASED BOATS
Coast Guard Cutter Operational Mishaps This graph depicts the major (Class A-C) operational mishaps reported by our cutter fleet from FY99 to FY03. Excluded from this graph are mishaps that took place while off duty (such as sports-related and motor vehicle injuries) and mishaps that occurred outside of the shipboard environment. The number of mishaps remained relatively steady when compared against FY02. However, given the increased reporting and filing due to implementation of the E-Mishap system and continued high levels of resource hours, the “real” mishap rate effectively decreased. However, the continued high numbers of mishaps should serve as a reminder to consistently use operational risk management while working in the marine environment.
Number of Cutter Mishaps by Type The above graph compares the number of reported Class A-D Marine mishaps by cutter type. As expected the platforms with the most operational hours tend to have the most mishaps.. Below, the marine mishaps are computed per 100,000 resource hours for cutter types for FY02 and FY03. Significant increases in rates were seen for 210’s, WAGB’s, WLI’s, WLIC’s and WTGB’s. In the cases of WAGB’s and WLI’s, relatively low resource hours increase the impact of individual mishaps on the rate. Several platforms had noticeable decreases in their mishap rates. Those include: WHEC’s, 270’s, 110’s, WLB’s and WLM’s. Overall, there was a 13% reduction from FY02 in the overall mishap rate for cutters. Cutter MARINE Mishap Rates by Type (per 100,000 Resource Hours)
Types of Cutter Mishaps What types of mishaps are occurring? This graph details the types of mishaps our cutters and crews are experiencing. For the third consecutive year, equipment mishaps (fouled screws, etc.), fires, collisions (both with fixed and floating objects), and falls occur most often. In FY03, the Main Space Fire Doctrine was set 29 times.
Cutter MARINE Mishap Rates By MISSION (per 100,000 Resource Hours) Looking at the mishap rates related to the most common mission areas for cutters, we see that although there was an overall decrease, there were noticeable increases in the mishap rate for all but ELT with the most noticeable a 29 point increase in the rate for Ice Operations. In addition to the missions you see above, 89 mishaps took place during Maintenance and Repair (M+R) periods, in ports away from homeport and at homeport. These are not computed as rates since there are no resource hours reported for M+R. This is a 25% increase from 71 mishaps a year ago. An increased focus needs to be placed on safety issues during these “down times.” Just because you are not in an operational environment does not mean that you are free from the hazards associated with working onboard a ship. ORM needs to be used whether underway or while conducting maintenance.
Causal Factors to Cutter Mishaps *70 % of cutter mishaps are due to human error.
Cutter-Based Boat Mishaps The above graph is a comparison of cutter boats for FY99 through FY03 Below, the mishaps are broken down into various “types” for the last five years. There were significant increases in PIW’s, Groundings, and Injuries. Cutter-Based Boat Mishaps by TYPE
SHORE-BASED BOATS
Number of Shore-Based Boat Operational Mishaps The above graph depicts (Class A-C) mishaps associated with Shore-based boat operations from FY99 to FY03. The trend upwards in Class C’s continued in FY03. A closer look at the data reveals that many of these mishaps were groundings and PIW’s that were not reported in previous years but are now due to the ease of using E-mishap. This does not alone account for the rise in mishaps. Other suspected factors are the increased operational tempo over the past two years creating stress and fatigue as well as the transition to new boat types. Extracting meaningful trends regarding the impact of transitions is difficult due to the wide variance between platforms, mishaps, and operational hours over the three year period. Boat Mishap Rate per 100,000 Resource Hours
Boat Mishap Rates by MISSION (per 100,000 Resource Hours) Above is a comparison of the mishap rates for the three most significant mission areas for shore boats over a period of four years. There was a significant increase in all three categories for FY03. Below is a look at the types and numbers of mishaps occurring. Although collisions and equipment damage account for the largest increase, groundings, injury, and overboards also increased. Boat Mishaps by Mishap Types
Overboard/PIW Mishaps by Boat Type The above graph depicts the number of mishaps in which personnel unintentionally entered the water by type of platform. UTL’s continue to be the leading asset in this category though the largest increase was in TPSB’s. Causal Factors to Boat Mishaps *69% of the boat mishaps are due to human error.
Overboard/PIW Mishaps by Boat Type The above graph depicts the number of mishaps in which personnel unintentionally enter the water by type of platform. Overall, the rates this type of mishap occurring on a non-standard boat was almost equivalent to that for standard boats. This is an improvement over FY01; the rate was two times higher for NSB’s. Causal Factors to Boat Mishaps 69% of boat mishaps are due to human factors!
MARINE SAFETY ACTIVITIES
Marine Safety Mishaps – On and Off Duty • We have seen a steady increase in MISHAPs reported from Marine Safety units throughout the past 4 years. This increase is believed to be the result of several factors. First is that reporting MISHAPs has become easier with the launch of the e-mishap system. More importantly the past 4 years have seen a change in missions throughout the Marine Safety field. This is observed through the steady increase in vessel-related MISHAPs. The final cause of an increase is the larger number of Activities, and combined Operational/Marine Safety commands. This has, coupled with the increased number of personnel assigned to Marine Safety Units, has increased the population reporting MISHAPs from a “Marine Safety” Unit. • While these factors explain the trend of increased MISHAPs a continued focus on safety at Marine Safety units is needed. The modification of the SOHC course and familiarity with new and emerging missions should help stem this trend. • Both Class “A” MISHAPs were off-duty motor vehicle accidents. It is important to note that while we take many precautions during working hours, and recognized many of the work-place hazards, it is far too often the after hours activities that can put us at increased risk of injury. • Both Class “B” MISHAPs occurred on-duty. FY 2002’s was a warehouse incident that occurred at a Group/MSO. This is an example of how combining units has increased the number of MISHAPs reported for marine safety units. • The FY 2003 MISHAP occurred during a vessel inspection and is a good case to briefly explore: • A 42-year-old Marine Inspector (MI) was completing an inspection of a hull insert. As the inspector was departing the vessel’s engine room, the MI slipped on the ladder way hyper-extending the right elbow, ultimately resulting in a permanent partial disability. The extent of the injury was not immediately recognized, the inspection was completed and MI did not report the incident until the pain and swelling increased throughout the rest of the day. This case is a good example of how the most routine tasks can be dangerous. • Please take time to think about your safety and consider the safe-work-practices for all of your activities, both on and off-duty.
Marine Safety – Safety Initiatives The Marine Safety Specialist position within G-WKS-4 has recently changed. The new Industrial Hygienist is LT Tom Olenchock. He may be contacted by email at tolenchock@comdt.uscg.mil or by phone at 202-267-2969. PPE: In FY03 all units should have received Oxygen GasAlertClips – the next generation of the Toxyclips – and 4-gas monitors called GasAlertMicros – replacement for the Scot 105. Some units also received specific Hydrogen Sulfide (H2S) GasAlertClips as well. This equipment will continue to be restocked at the unit level by HQ. Additionally, EEBAs have been replaced with Ocenco M20.2b Emergency Escape Breathing Devices (EEBDs). All of this equipment has been provided for entry into confined spaces, vessel boarding/inspections, and emergency response activities. Emergency Response (HAZWOPER) Training: We continue to train roughly 150 unit level trainers to provide First Responder Operations (FRO) and First Responder Awareness (FRA) training to all units in their area. With the release of COMDINST 3400.3, there has been a marked increase in units requesting this training. We are also in the process of finalizing the Weapons of Mass Destruction (WMD) FRA training curriculum. THANKS to the many current trainers for helping set the methodology and content of this training block. Other Current Initiatives: Some other current efforts underway include the revising of Safety and Occupational Health Coordinator (SOHC) course material; this should be completed for the first course in July of 2004. A database has been created to store unit-level Safe Work Practices and we are currently populating it with a planned availability of Fall ‘04.
TEAM COORDINATION TRAINING (TCT) FY-2003 was an extremely challenging but highly successful TCT year. In comparison to FY-2002, the total number of actively engaged TCT Facilitators jumped from 69 to 127. More importantly, the total number of students (Active Duty, Auxiliarists, and Reservists) receiving unit-level, exportable TCT increased from 6,991 to 8,225 and the average cost per student decreased from $18.68 to $14.10 per student. TCT continues to be integrated throughout the Coast Guard workforce. On page 4 of the 2003 Winter Edition, Vol. 30 of “The Navigator”, the official magazine of the United States Coast Guard Auxiliary, “the principles of TCT and good seamanship helped save the day, and everybody went home safely.” This story had a great ending! We all want our people to make it home safely after each day performing their duty in support of the various Coast Guard missions, including homeland security. The performance of TCT Facilitators, TCT District Administrators, TRACEN Petaluma Instructional Systems School staff, USCG Academy Command and Operations School staff, and the Training Quota Management Center (TQC) was extraordinary in FY-2003! It has been my pleasure working with everyone throughout FY-2003. LCDR Kathryn L. Oakley
FY-2003 TCT STATISTICS ·Total number of students receiving TCT Resident Training: 143 45 TCT-Group Operations (Course Code 500687) 67 TCT-Cutter Operations (Course Code 500686) 31 TCT-Facilitator Training (Course Code 500688) ·Total number of students receiving Exportable, TCT Unit-Level Training (Course Code 500834) (as reported by District TCT Administrators and LANT/PAC Area Training Teams): 8,225 ·Total number of active district TCT Facilitators: (does not include LANT/PAC AREA Training Team instructors) 127 ·Exportable, TCT unit-level training program average cost per student/quota: $14.10 which keeps it very competitive for training dollars as it optimizes performance at the lowest cost per quota of any AFC-56 funded training
In accordance with Team Coordination Team (TCT), COMDTINST 1541.1, all requests for exportable, TCT-unit level training (500834) shall be forwarded to the cognizant District TCT Administrator and/or coordinated through the appropriate Auxiliary division captains for Auxiliary TCT. Current (as of 19 April 2004) District TCT Administrators (and work phone numbers) are listed below for reference: D1(reserve): CDR S. Tarantino (203) 933-1603 D5(oax): CWO J. C. Baker (757) 398-6509 D7(oax): CWO R. Flynn (305) 415-7053 D8(oax): CWO J. Temple (504) 589-2972 D9(cc): LTJG C. M. Pasciuto (216) 902-6117 D11(osr): BMC S. Tierney (510) 437-5366 D13(cc): LT C. J. Cunningham (206) 220-7004 D14(osr): LCDR J. Janszen (808) 541-2312 D17(oan) MCPO D. Coffman (907) 463-2266 Other helpful information: ·COMDT TCT Program Manager: CWO Josh Henley: Jhenley@comdt.uscg.mil (202) 267-2964 or 1-800-842-8740, Ext. 72964 ·Afloat & Marine Safety Division (G-WKS-4) / TCT/ORM web site: http://www.uscg.mil/hq/G-W/g-wk/g-wks/g-wks-4/index.htm ·Office of Boat Forces (G-OCS) Boat Forces Newsletter web site: http://cgweb.comdt.uscg.mil/g-ocs/BFN%20home.htm ·Training Quota Management Center (TQC) web site: http://www.uscg.mil/hq/tqc ·Coast Guard Institute (CGI) web site: http://www.uscg.mil.hq/cgi