PERCEPTION
PERCEPTION. By Juan Gabriel Estrada Alvarez. The Papers Presented. Perceptual and Interpretative Properties of Motion for Information Visualization , Lyn Bartram, Technical Report CMPT-TR-1997-15, School of Computing Science, Simon Fraser University, 1997

PERCEPTION
E N D
Presentation Transcript
PERCEPTION By Juan Gabriel Estrada Alvarez
The Papers Presented • Perceptual and Interpretative Properties of Motion for Information Visualization, Lyn Bartram, Technical Report CMPT-TR-1997-15, School of Computing Science, Simon Fraser University, 1997 • To See or Not to See: The Need for Attention to Perceive Changes in Scenes, Rensink RA, O'Regan JK, and Clark JJ. Psychological Science,8:368-373, 1997 • Internal vs. External Information in Visual Perception Ronald A. Rensink. Proc. 2nd Int. Symposium on Smart Graphics, pp 63-70, 2002
The Papers Presented • Perceptual and Interpretative Properties of Motion for Information Visualization, Lyn Bartram, Technical Report CMPT-TR-1997-15, School of Computing Science, Simon Fraser University, 1997 • To See or Not to See: The Need for Attention to Perceive Changes in Scenes, Rensink RA, O'Regan JK, and Clark JJ. Psychological Science,8:368-373, 1997 • Internal vs. External Information in Visual Perception Ronald A. Rensink. Proc. 2nd Int. Symposium on Smart Graphics, pp 63-70, 2002
Perceptual and Interpretative Properties of Motion for Information Visualization • (Static) Graphical representations (eg. Shape, symbols, size, colour, position) are very effective in infovis because they exploit the preattentive process of the human visual system when used well • Nonetheless, when the perceptual capacity to assimilate all the combinations of codes and dimensions is exceeded, more cognitive effort is required
Introduction • Complex systems such as those used in supervisory control and data acquisition are characterized by large volumes of dynamic information which don’t reasonably fit into a single display • The interface of such systems should not only display the data reasonably, they should also: • Signal the user when important changes take place • Indicate clearly when data are associated or related in some way
The Bandwidth Problem • Data acquisition capabilities of control systems have increased: the operator’s role has evolved from low-level manual control to high-level management and supervision • Thus the complexity of the underlying information space and the volume of data used in the operator’s tasks has “ballooned” • The display capacity can be increased, but there are limits in the user’s perceptual capacity
Bandwidth Problem • Most common display dimensions for coding value and state are colour, position and size. Symbols and icons are heavily used • But the number of symbols which can be perceptually decoded is limited to about 33 (process and network displays use much larger symbol sets) • Similarly, color is over-used in most systems (fully saturated hue is the dominant code, when we can distinguish only 7-10 hues) • Most common indication of fault (alarm) is blinking or flashing the relevant display element • Most displays are densely populated and the subscribed display dimensions over-used. Thus flashing or blinking causes data overload • Since the interfaces of these complex systems suffer from the above, we get too much direct data and not enough “information”
Insufficient Information • Current systems are deficient in 3 areas: • Effective representation of how the system changes; the most crucial requirement to understanding a dynamic system. This is too difficult with static graphical representations • Integration of data across displays; “inviting all the right pieces of info to the party” • Representation of data relationships; no well-established techniques to display the dynamic relations between elements (association, dependencies, sequence/order, causality)
Perceptual Principles for Visualization • Proximity compatibility: depends on two dimensions • Perceptual proximity: how close together 2 display channels are in the user’s perceptual space (i.e. how similar they are) • Processing proximity: the extent to which sources are used as part of the same task • Emergent Features are useful for integrative tasks • “properties inherent in the relations between raw data encoding which serve as a direct cue for an integration task which would otherwise require computation or comparison of the individual data values.” • Directed Attention • The user should be able to pick up signals without losing track of current activities • Such a signal should carry enough partial info for the user to decide whether to shift attention to the signaled area • The representation should be processed with no cognitive effort
Ecological Approach • Ecological Perception: “We perceive our environment directly as ecological entities and movement” • The composition and layout of objects in the environment constitute what they can afford to the observer • Ecological Interface Design: represent higher-order function, state and behaviour information of a system as task-relevant variables integrated over lower-level system data
The Design Challenge • Two directions must be followed to minimize info overload in the user interfaces to complex systems: • Explore new perceptually effective ecological representations to increase info dimensionality (and hence interface bandwidth) • Determine whether these new coding dimensions can extend the integrative effect across displays and representations separated by space and time
3 Reasons to believe in Motion • Perceptually efficient at a low level • Motion perception is a preattentive process, and it degrades less than spatial acuity or colour perception in the “periphery” • Human visual system is good at tracking and predicting movement (“intuitive physics”) • We use motion to derive structure, animacy and emotion
3 Reasons to believe in Motion • It has a wide interpretative scope • “Motion is cognitively and ecologically rich… motions are ecological events to do with the changes in the layout and formation of objects and surfaces around us” • Motion affords behaviour and change • Drama, dance and music map very complex emotions on to gestures and movement • Motion is under-used and thus available as a “channel” of information
Motion as a Display Dimension • “What are the salient perceptual features of motion? What are the emergent and behavioural properties? Can they be “tuned” to influence/alter its meaning?” • “What do motions “mean”? Is there any inherent tendency to assign any semantic association to types of motion? Can motion semantics be divorced from those of the moving object?”
Motion as Meaning • Roughly classify the perceptual and interpretative characteristics of movement that may convey meaning as giving insight into • Basic Motion: relating to perceptual properties (basic parameters that affect the meaning somehow e.g. velocity, frequency, etc.) • Interpretative Motion: the type of motion produced by basic motion parameters together represents the behaviour and meaning (state) of the system (a complex motion may be a combination of several types) • Compound Motion: a combination of two or more movement sequences which elicits the effect of a single perceptual and interpretative event (e.g. an event that causes another event to be triggered - causality)
Questions to be answered • “What is the “coding granularity” of motion? How many different motions can be used together for coding without interfering with each other? What other modalities reinforce/countermand the effects of motion?” • “What can motion afford in the virtual ecology of the complex system interface, and how can we best exploit these affordances?”
Potential Applications • Annunciation and signalling: “ensure that users notice, comprehend and respond appropriately to alarms and system messages in a reasonable response time” • Grouping and integration: foster the immediate recognition of associated elements scattered across the visual field • Communicating data relationships: combine the “movements of separate elements in their existing displays and representations in a way that elicits the immediate perception of how the data are related”
Potential Applications • Data display and coding: represent dynamic data (e.g. internet communication traffic ) • Represent change (e.g. animate a data representation to convey a recent change, and the nature of the movement to convey to what degree it did so) • Drawing attention or perception to a desired area
Implementation Issues • We must watch out for perceptual artifacts such as Motion After-Effect (MAE), Induced motion and Motion parallax • Guarantee smooth motion (12-14 frames per sec.) and correct synchronization of movements • Realistic motion based on dynamics, etc. is computationally expensive • Forward kinematics (take into account only geometric and movement properties) can be carried out in real time. There is evidence that we employ kinematic principles for perception
Conclusions • Motion is perceptually efficient, interpretatively powerful and under-used • It is a good candidate as a dimension for displaying information in user interfaces to complex systems • It can display data relationships and higher-order system behaviour that static graphical methods cannot • There is little knowledge to guide its application to information displays • An initial taxonomy of motion properties and application has been developed as a framework for further empirical investigation into motion as a useful display dimension
Critique • The pros • Clearly did an extensive research on the literature • Made reference to several examples as evidence of the views presented • The idea is indeed promising • The cons • Nonetheless the examples were too many, perhaps some of them unnecessary • Absolutely no figures to help the user understand the examples or ideas. With that many examples, hardly anybody would want to read all of the cited papers to hunt for such figures • A lot of redundancy. The paper could have been shorter • It did not take into account the problem of change blindness, as we will see in the next two papers
The Papers Presented • Perceptual and Interpretative Properties of Motion for Information Visualization, Lyn Bartram, Technical Report CMPT-TR-1997-15, School of Computing Science, Simon Fraser University, 1997 • To See or Not to See: The Need for Attention to Perceive Changes in Scenes, Rensink RA, O'Regan JK, and Clark JJ. Psychological Science,8:368-373, 1997 • Internal vs. External Information in Visual Perception Ronald A. Rensink. Proc. 2nd Int. Symposium on Smart Graphics, pp 63-70, 2002
To See or Not to See: The Need for Attention to Perceive Changes in Scenes • Consider a driver whose mind wanders during driving. He can often miss important road signs, even when these are highly visible. The information needed for perception is available to him. Something, however, prevents him from using this information to see the new objects that have entered the field of view. • Hypothesis: the key factor is attention. A change is perceived in the visual field only if attention is being given to the part being changed • To support this view, experimentation was performed
Change blindness • The phenomenon has been previously encountered in two different experimental paradigms • The first experiment (concerned with visual memory) investigated the detection of change in briefly presented array of simple figures or letters • The second experiment (concerned with eye-movement studies) examined the ability of observers to detect changes in an image made during a saccade.
Flicker paradigm • Developed to test whether both types of change blindness were due to the same attentional mechanism, and whether said mechanism could lead to change blindness under more normal viewing conditions • Basically, alternate an original image A with a modified image A’, with brief blank fields placed between successive images
Flickering Paradigm • Differences between original and modified images can be of any size and type (here chosen to be highly visible) • The observer freely views the flickering display and hits a key when change is perceived, reporting the type of change and the part of the scene where change occurred • This paradigm allows combination of the techniques, conditions and criteria used in both previous experiments
Experimentation • Change blindness with brief display techniques might have been caused by insufficient time to build an adequate representation of the scene • Saccade-contingent change might have been caused by disruptions due to eye movements • Both factors are removed from this experiment. Therefore if they are the cause, perception of change should now be easy • However, if attention is key factor, a different outcome will be obtained
Experiment 1 • As previously described, to discover if flicker paradigm could induce change blindness • MI changes were on avg. over 20% larger than CI changes
Experiment 2 • Perhaps old and new scene could not be compared due to time limitations. Fill in the 80ms blank with a presentation of the “surrounding” images for total of 560ms per image, no blanks.
Experiment 3 • Perhaps the flicker reduces the visibility of the items in the image making them difficult to see. Repeat experiment 1, but this time with verbal cues (single words or word pairs)
Conclusions • Under flicker conditions, observers can take a long time to perceive large changes • This is not due to a disruption of the information received or to a disruption of its storage. It depends largely on the significance of the part changed • Much of the blindness to saccade-contingent change is due to a disruption of the retinal image during a saccade that causes swamping of the local motion signals that draw attention (similarly for the blindness in brief-display studies)
Proposal • “Visual perception of change in an object occurs only when that object is given focused attention” • “In the absence of such attention, the contents of visual memory are simply overwritten by subsequent stimuli, and so cannot be used to make comparisons”
Critique • The pros • Ideas are nicely laid out and straightforward • Hypothesis supported by empirical evidence • Experiments were nicely setup • The cons • The study was done only on 10 subjects, giving rise to questions about the results
The Papers Presented • Perceptual and Interpretative Properties of Motion for Information Visualization, Lyn Bartram, Technical Report CMPT-TR-1997-15, School of Computing Science, Simon Fraser University, 1997 • To See or Not to See: The Need for Attention to Perceive Changes in Scenes, Rensink RA, O'Regan JK, and Clark JJ. Psychological Science,8:368-373, 1997 • Internal vs. External Information in Visual Perception Ronald A. Rensink. Proc. 2nd Int. Symposium on Smart Graphics, pp 63-70, 2002
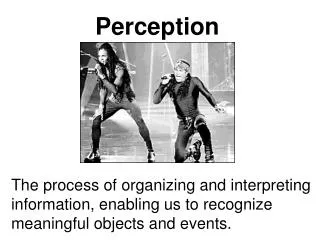
Internal vs. External Information in Visual Perception • When we look around us, we get the impression that we see all the objects simultaneously and in great detail • People believed then that we represent all these objects at the same time, with each having a description that is detailed and coherent • The description could be formed by accumulating information in an internal visual buffer, and all subsequent visual processing would be based on this buffer
Change blindness • But a number of recent studies (including the previously discussed paper) argue against such an idea • Change blindness can be induced in many ways (eye blinks, movie cuts, etc.) • Its generality and robustness suggest it involves mechanisms central to our visual experience of the world
Coherence theory • If there’s no buffer, how is it possible to see change? • Propose coherence theory, based on the proposal of the last paper, and 3 related hypotheses
Virtual representation • The representation proposed is very limited in the information it can contain. Why do we not notice these limitations? • Virtual representation: • create only a coherent, detailed representation only of the object needed for the task at hand • If attention can be coordinated such that the representation is created whenever needed, all the objects will appear to be represented in great detail simultaneously • This representation has all the power of a real one, using much less memory and processing resources
Virtual Representation • For the virtual representation to successfully operate • Only a few objects need to have a coherent representation at any time • Detailed info about any object must be available upon request • Thus perception involves a partnership between the observer and their environment. No need to build an internal recreation of the incoming image, the observer simply uses the visual world as an external memory whenever needed
Triadic architecture • For successful use of the virtual representation in human vision, eye movements and attentional shifts must be made to the appropriate object at the right time • How to direct these movements and shifts? • How do these systems interact?
Nonattentional perception • The architecture is based on a nontraditional view • Attention is just one of several concurrent streams (the stream concerned with conscious perception of coherent objects) • The other streams don’t rely on attention and thus operate independently of it • Little is known about these nonattentional streams • One example is subliminal perception • Mindsight: observers watching a flicker display sense that a change is occurring, but they don’t have a visual experience of it.
How this view could be used in displays • For attentional pickup of information • Coherence theory establishes that attention acts via a coherence field that links 4-5 proto-objects to a single nexus. The nexus collects the few attended properties of those proto-objects along with a coarse description of the overall shape of the item • Therefore any proto-object can be attentionally subdivided and the links assigned to its parts. Conversely, the links could be assigned to several separate proto-objects, forming a group that corresponds to an object • We should create then active displays (graphics and user interfaces) that output visual information that matches this style of information pickup
How this view could be used in displays • For visual transitions • Change blindness makes invisible unattended transitions that could interfere with an observer’s awareness • Such invisibility can be good when we want to eliminate noninformative transitions in graphics • But we must make sure it doesn’t happen in user interfaces where we want the user to not miss important changes in the system
How this view could be used in displays • For attentional coercion • The display can take control of attentional allocation to make the observer see (or not see) any given part of the display • This coercion has long been used in films to focus the attention on elements that should not be missed • It could be used by interfaces to ensure that important events will not be missed by the user by directing his/her attention to the appropriate item at the right time
How this view could be used in displays • For nonattentional pickup of information • Nonattentional streams are capable of having an effect on observer’s behaviour. Thus, new kinds of effects in displays could be created • In graphics, we could induce effects on a viewer that are not experienced in a direct way (e.g. might be experienced as a sixth sense) • We could imagine user interfaces that aid the user in doing “the right thing” without the user being aware he/she is being guided (like a sixth sense)
Critique • The pros • All ideas are expressed intuitively and facilitates understanding • The figures (shown also in this presentation) are an effective aid in understanding the views proposed • Provides guidelines as to how to integrate motion into infovis (that were being sought in the first paper) • Neutral • No practical software examples of the theory in action are provided