Download
1 / 29
290 likes | 443 Vues
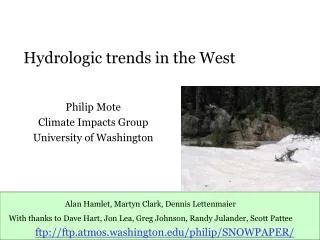
Hydrologic trends in the West. Philip Mote Climate Impacts Group University of Washington. Alan Hamlet, Martyn Clark, Dennis Lettenmaier With thanks to Dave Hart, Jon Lea, Greg Johnson, Randy Julander, Scott Pattee. ftp://ftp.atmos.washington.edu/philip/SNOWPAPER/.

E N D
Hydrologic trends in the West Philip Mote Climate Impacts Group University of Washington Alan Hamlet, Martyn Clark, Dennis Lettenmaier With thanks to Dave Hart, Jon Lea, Greg Johnson, Randy Julander, Scott Pattee ftp://ftp.atmos.washington.edu/philip/SNOWPAPER/
The Columbia Basin’s snow in a warming world 20th c. 2020s 2040s April 1 snow water equivalent (mm)
This talk • Significant hydrologic changes will occur for 2-4°F warming • The Northwest has already seen 1.5°F warming in the 20th century • Have hydrologic changes been observed? • Are they consistent with the warming and the model projections?
decrease increase Data from NRCS, CA DWR, BC SRM 824 snow courses/SNOTEL Trends in April 1 SWE, 1950-2000 Relative to 1950 value 73% – trends Large – trends PNW Some + trends SW
VIC simulation • 1/8° long x 1/8° lat, west of Continental Divide • Daily weather data, 1/1/1915 - 9/30/97 interpolated to VIC grid points from Coop stations • Long-term trends interpolated from USHCN stations
Trends in timing of peak snowpack Figure by Alan Hamlet, UW Change in Date
Regional average April 1 SWE Obs o VIC x
Relating SWE to climate data • US Historical Climate Network (USHCN) • Use nearest 5 stations to form reference time series T(t) and P(t) • Correlation between Apr 1 SWE and T or P • Regression: SWE(t)=aTT(t) + aPP(t)+(t) • Components of trend aT<T> and aP<P>
Correlations between Nov-Mar climate and Apr 1 SWE X-direction: precip Y-direction: temp Coldest locations insensitive to temperature Cascades very sensitive
April 1 SWE trends, 1950-2002 aT<T> aP<P>
Trends in timing of spring snowmelt (1948-2000) +20d later –20d earlier Courtesy of Mike Dettinger, Iris Stewart, Dan Cayan
As the West warms, winter flows rise and summer flows drop Figure by Iris Stewart, Scripps Inst. of Oceanog. (UC San Diego)
Conclusions • Observations show substantial declines in western snowpack, corresponding changes in flow • Largely temperature-driven • Cascades, N. Calif most temp-sensitive • Large increases in precipitation have offset warming in some places • Warming trends very likely to continue ftp://ftp.atmos.washington.edu/philip/SNOWPAPER/
April 1 SWE trends, 1930-2002 aP<P> aT<T>
At almost every USHCN station, winters warmed + signs: warming but not statistically significant
Winters wetter in much of the West Drier in some of Northwest (PDO)
Declining snowpack in the Cascades From the VIC simulation