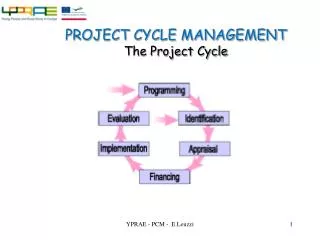
The catering cycle
The catering cycle. Figure 1.1 After Cracknell et al . 2000. Comparison of traditional and systems approaches. Table 1.1 Source: Records and Glennie (1991). Three systems in food and beverage operations. Operations hierarchy. Table 1.2. Dimensions of the hospitality industry’s product.

The catering cycle
E N D
Presentation Transcript
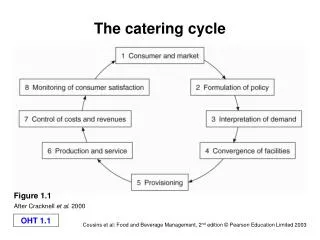
The catering cycle Figure 1.1 After Cracknell et al. 2000
Comparison of traditional and systems approaches Table 1.1 Source: Records and Glennie (1991)
Operations hierarchy Table 1.2
Dimensions of the hospitality industry’s product • Intangibility • Perishability • Simultaneous production and consumption • Ease of duplication • Heterogeneity • Variability of output • Difficulty of comparison
Customer satisfactions • Physiological needs • Economic needs • Social needs • Psychological needs • Convenience needs
Customer dissatisfactions • Controllable by the establishmente.g. scruffy, unhelpful staff, cramped conditions • Uncontrollablee.g. behaviour of other customers, the weather,transport problems
Reasons for eating out • Convenience • Variety • Labour • Status • Culture / tradition • Impulse • No choice
Meal experience factors • Food and drink on offer • Level of service • Level of cleanliness and hygiene • Perceived value for money and price • Atmosphere of the establishment
PESTLE factors • P Political • E Economic • S Socio-cultural • T Technological • L Legal • E Ecological
The five competitive forces Figure 1.4 Adapted with the permission of The Free Press, a Division of Simon & Schuster, Inc., from Competitive Advantage: Creating and Sustaining Superior Performance by Michael E. Porter. Copyright © 1985, 1998 by Michael E. Porter
European Foundation for Quality Management Excellence Model Figure 1.6 Adapted from EFQM, 1999
Customer service versus resource productivity Customer service Resource productivity Figure 1.7
Integrated Service QualityManagement Model Figure 1.8