Download
1 / 6
60 likes | 96 Vues
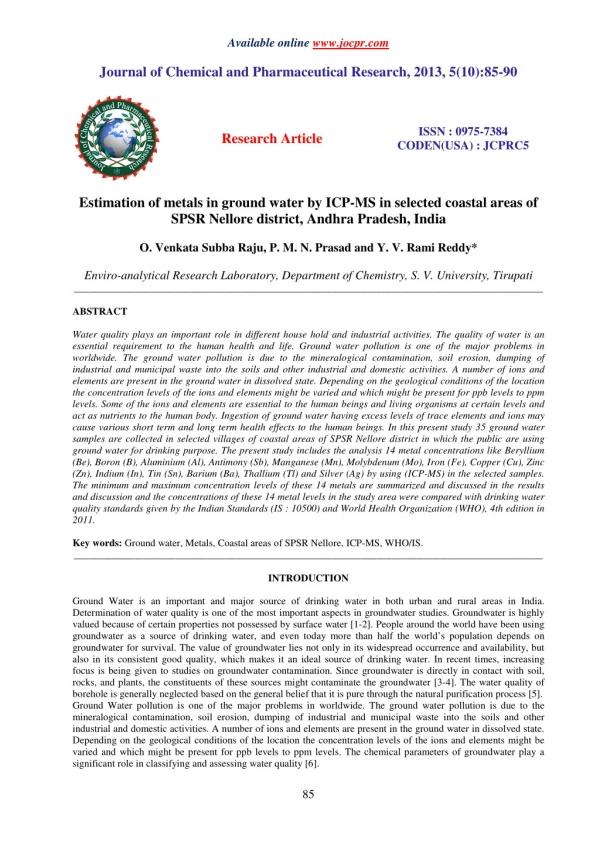
Water quality plays an important role in different house hold and industrial activities. The quality of water is an<br>essential requirement to the human health and life. Ground water pollution is one of the major problems in<br>worldwide. The ground water pollution is due to the mineralogical contamination, soil erosion, dumping of<br>industrial and municipal waste into the soils and other industrial and domestic activities. A number of ions and<br>elements are present in the ground water in dissolved state. Depending on the geological conditions of the location<br>the concentration levels of the ions and elements might be varied and which might be present for ppb levels to ppm<br>levels. Some of the ions and elements are essential to the human beings and living organisms at certain levels and<br>act as nutrients to the human body. Ingestion of ground water having excess levels of trace elements and ions may<br>cause various short term and long term health effects to the human beings. In this present study 35 ground water<br>samples are collected in selected villages of coastal areas of SPSR Nellore district in which the public are using<br>ground water for drinking purpose. The present study includes the analysis 14 metal concentrations like Beryllium<br>(Be), Boron (B), Aluminium (Al), Antimony (Sb), Manganese (Mn), Molybdenum (Mo), Iron (Fe), Copper (Cu), Zinc<br>(Zn), Indium (In), Tin (Sn), Barium (Ba), Thallium (Tl) and Silver (Ag) by using (ICP-MS) in the selected samples.<br>The minimum and maximum concentration levels of these 14 metals are summarized and discussed in the results<br>and discussion and the concentrations of these 14 metal levels in the study area were compared with drinking water<br>quality standards given by the Indian Standards (IS : 10500) and World Health Organization (WHO), 4th edition in<br>2011. <br>

E N D
Available online www.jocpr.com Journal of Chemical and Pharmaceutical Research, 2013, 5(10):85-90 ISSN : 0975-7384 CODEN(USA) : JCPRC5 Research Article Estimation of metals in ground water by ICP-MS in selected coastal areas of SPSR Nellore district, Andhra Pradesh, India O. Venkata Subba Raju, P. M. N. Prasad and Y. V. Rami Reddy* Enviro-analytical Research Laboratory, Department of Chemistry, S. V. University, Tirupati _____________________________________________________________________________________________ ABSTRACT Water quality plays an important role in different house hold and industrial activities. The quality of water is an essential requirement to the human health and life. Ground water pollution is one of the major problems in worldwide. The ground water pollution is due to the mineralogical contamination, soil erosion, dumping of industrial and municipal waste into the soils and other industrial and domestic activities. A number of ions and elements are present in the ground water in dissolved state. Depending on the geological conditions of the location the concentration levels of the ions and elements might be varied and which might be present for ppb levels to ppm levels. Some of the ions and elements are essential to the human beings and living organisms at certain levels and act as nutrients to the human body. Ingestion of ground water having excess levels of trace elements and ions may cause various short term and long term health effects to the human beings. In this present study 35 ground water samples are collected in selected villages of coastal areas of SPSR Nellore district in which the public are using ground water for drinking purpose. The present study includes the analysis 14 metal concentrations like Beryllium (Be), Boron (B), Aluminium (Al), Antimony (Sb), Manganese (Mn), Molybdenum (Mo), Iron (Fe), Copper (Cu), Zinc (Zn), Indium (In), Tin (Sn), Barium (Ba), Thallium (Tl) and Silver (Ag) by using (ICP-MS) in the selected samples. The minimum and maximum concentration levels of these 14 metals are summarized and discussed in the results and discussion and the concentrations of these 14 metal levels in the study area were compared with drinking water quality standards given by the Indian Standards (IS : 10500) and World Health Organization (WHO), 4th edition in 2011. Key words: Ground water, Metals, Coastal areas of SPSR Nellore, ICP-MS, WHO/IS. _____________________________________________________________________________________________ INTRODUCTION Ground Water is an important and major source of drinking water in both urban and rural areas in India. Determination of water quality is one of the most important aspects in groundwater studies. Groundwater is highly valued because of certain properties not possessed by surface water [1-2]. People around the world have been using groundwater as a source of drinking water, and even today more than half the world’s population depends on groundwater for survival. The value of groundwater lies not only in its widespread occurrence and availability, but also in its consistent good quality, which makes it an ideal source of drinking water. In recent times, increasing focus is being given to studies on groundwater contamination. Since groundwater is directly in contact with soil, rocks, and plants, the constituents of these sources might contaminate the groundwater [3-4]. The water quality of borehole is generally neglected based on the general belief that it is pure through the natural purification process [5]. Ground Water pollution is one of the major problems in worldwide. The ground water pollution is due to the mineralogical contamination, soil erosion, dumping of industrial and municipal waste into the soils and other industrial and domestic activities. A number of ions and elements are present in the ground water in dissolved state. Depending on the geological conditions of the location the concentration levels of the ions and elements might be varied and which might be present for ppb levels to ppm levels. The chemical parameters of groundwater play a significant role in classifying and assessing water quality [6]. 85
Y. V. Rami Reddy et al ______________________________________________________________________________ J. Chem. Pharm. Res., 2013, 5(10):85-90 Environmental health involves all the factors, circumstances and conditions in the environment or surroundings of humans that can influence health and well being. Some of the ions and elements are essential to the human beings and living organisms at certain levels and act as nutrients to the human body. Ingestion of ground water having excess levels of trace elements and ions may cause various short term and long term health effects to the human beings. The neglect of rural areas in most developing countries in terms of basic infrastructures such as pipe-borne water and sanitation facilities, expose the villagers to a variety of health related problems such as water – borne diseases [7]. Trace metals in natural water samples are measured routinely and controlled by municipalities. Concentration of trace metals in natural waters varies widely as a function of time, depending on the discharger source, season, types of urban activities, etc. To measure variations it is advantageous to carry out remote measurements automatically in the field instead of carrying out one or two weekly analyses in laboratories. All living organisms on the earth needs water for their survival and growth. Due to increased human population, industrialization, use of fertilizers in the agriculture and man-made activity it is highly polluted with different harmful contaminants. Therefore it is necessary that the quality of drinking water should be checked at regular time interval, because due to use of contaminated drinking water, human population suffers from water borne diseases. It is difficult to understand the biological phenomena fully because the chemistry of water levels much about the metabolism of the ecosystem and explain the general hydro - biological relationship [8]. Metal-bearing solids at contaminated sites can originate from a wide variety of sources in the form of airborne emissions and process solid wastes [9]. Water for human consumption must be free from micro-organisms and chemical substances in concentrations large enough to cause environmental imbalance and disease [10]. Rapid urbanization especially in developing countries like India, has affected the availability and quality of ground water due to its over exploitation and improper waste disposal, especially in urban areas [11]. According to WHO (2004) about 80% of the diseases in human beings are caused by polluted water. As the water is the most important component of eco–system, any imbalance created either in term of amount, which is presence of impurities added to it can harm the whole eco–system [12]. A number of metallic ions cause metabolic disturbances in man by upsetting the production and function of certain enzymes, or to cause a variety of other toxic effects [13]. In India groundwater is used for domestic and agricultural purposes. Similarly most of the industries are using ground water for their manufacturing and cleaning purposes, this used water come out as a waste water. Heavy metals are basically present in groundwater but these play an important role in determining the quality of water for drinking purposes [14-15]. Ground water has been using for domestic and industrial water supply and irrigation purposes all over the world [16-17]. The SPSR Nellore District has a coastal line of 169 Kms covering 12 mandals. There are 93 coastal fishermen habitations having 82500 population out of which 16300 are active fishermen. The estimated marine landings in the District are 54941 mts. There is a Pulicat Lake which is the 2nd biggest Brackish Water Lake in the country with an area of 468 Sq.Kms. The lake accounts for annual production of 6500 Mts. of Fishey wealth providing livelihood to 11000 Fishermen covering 20 villages around the lake. In most of the villages of SPSR Nellore district the public is using ground water for drinking and house hold purpose. There might be chances to get contamination of ground water with different elements and ions at higher concentration levels. In this present study an attempt has been made to estimate the concentration levels of 14 metals like Beryllium (Be), Boron (B), Aluminium (Al), Antimony (Sb), Tin (Sn), Manganese (Mn), Molybdenum (Mo), Iron (Fe), Copper (Cu), Zinc (Zn), Indium (In), Barium (Ba), Thallium (Tl) and Silver (Ag) by using (ICP-MS) in ground water of 35 village areas of eastern coastal part of SPSR Nellore district, Andhra Pradesh using Inductively Coupled Plasma – Mass Spectrometer (ICP-MS). The details of sampling locations are given in Table – 1. A number of sophisticated instruments (like ICP-MS, ICP-OES, AAS, UV-VIS spectrometer, Cyclic Voltammetry, etc.) are using for the determination of metals in water. Inductively Coupled Plasma – Mass Spectrometer (ICP-MS) is one of the most widely and universally using technique for the determination of metals contaminants in water upto parts per billion (ppb) levels. By using ICP-MS, we can determine upto 0.1µg/L of metal concentration in water. The 14 metals are determined by using ICP-MS technique and the observed metal levels in the study area were compared with drinking water quality standards given by the Indian Standards (IS : 10500) and World Health Organization (WHO), 4th edition in 2011. 86
Y. V. Rami Reddy et al ______________________________________________________________________________ J. Chem. Pharm. Res., 2013, 5(10):85-90 EXPERIMENTAL SECTION SAMPLE COLLECTION: The ground water samples are collected by following of standard sample collection protocol and guidelines given in Indian Standards methods IS: 3025 part-1 and American Public Health Association (APHA) 22nd edition. Special precautions were taken during the sampling of metals. Before collecting the samples, the sample containers are soaked overnight in 2% nitric acid and washed with double distilled water and dried in clean metal free area. At each sampling location, water samples were collected in two pre-cleaned containers for duplicate measurement. The bottles were rinsed three times with the ground water sample of the particular location and collected the final sample to avoid the contamination and 0.5 ml of Supra pure grade nitric acid is added to acidify the samples and also to prevent the loss of metals. All the collected ground water samples are preserved at 4oC by using thermo-coal box with ice packs. The details of sampling locations have been summarized in Table -1. DETAILS OF SAMPLING LOCATIONS: TABLE -1 LOCATION CODE LOCATION NAME GW- 1 SULLURUPETA GW- 2 SRIHARIKOTA GW- 3 MEEZURU GW- 4 KATTUVAPALLE GW- 5 KUMMARIPALLEM GW- 6 ELLORE GW- 7 KOGILI GW- 8 JALAPEDDIPALEM GW- 9 DEVUNI KHANDRIKA GW-10 VAKADU GW-11 SIDDAVARAM GW-12 VENKANNAPALLEM GW-13 GOVINDAPALLI GW-14 MOMIDI GW-15 PUDIPARTHI GW-16 INDUPURU GW-17 ALLURU GW-18 KOTHAPALEM ANALYTICAL METHODOLOGY: Trace metals are analyzed using ICP-MS (Agilent 7500) Standard reference material of 1000mg/L (Multi elements- Merck) is used for analysis of trace elements. Seven different linear concentration standards are prepared ranging from 0.001 mg/L to 0.5 mg/L. Before doing sample analysis different concentrations of standards were analyzed and prepared linear curve. All the metals having good linear graph with correlation coefficient of > 0.999 is observed in standard curves preparation. RESULTS AND DISCUSSION ICP-MS is the most widely using technique for the determination of trace metals up to parts per billion levels. ICP- MS is very useful technique to determine trace levels of multi -elements in single aspiration. The quantity of 14 metals (Beryllium, Boron, Aluminium, Antimony, Tin, Manganese, Molybdenum, Iron, Copper, Zinc, Indium, Barium, Thallium and Silver) observed in the 35 villages of coastal areas of SPSR Nellore district has been summarized in Table -2 and the results are discussed below. LOCATION CODE GW- 19 GW-20 GW-21 GW-22 GW-23 GW-24 GW-25 GW-26 GW- 27 GW-28 GW-29 GW-30 GW-31 GW-32 GW-33 GW-34 GW-35 LOCATION NAME JUVVALAPALEM THUMMALAPENTA RAMAYAPATNAM AMUDALA PADU NELATURU CHERUVU PYNAPURAM KRISHNAPATNAM NIDIGUNTAPALEM MOLLURU KAPPALATHERUVU BRAHMADEVAM MUTTUKURU EPURE VARAKAVIPUDI PEDDAMAMBATTU KONDURU GOPALAREDDIPALEM 87
Y. V. Rami Reddy et al ______________________________________________________________________________ J. Chem. Pharm. Res., 2013, 5(10):85-90 TABLE -2 S.NO 1 2 3 4 5 6 7 8 9 10 11 12 13 14 15 16 17 18 19 20 21 22 23 24 25 26 27 28 29 30 31 32 33 34 35 GROUND WATER UNIT GW-1 GW-2 GW-3 GW-4 GW-5 GW-6 GW-7 GW-8 GW-9 GW-10 GW-11 GW-12 GW-13 GW-14 GW-15 GW-16 GW-17 GW-18 GW-19 GW-20 GW-21 GW-22 GW-23 GW-24 GW-25 GW-26 GW-27 GW-28 GW-29 GW-30 GW-31 GW-32 GW-33 GW-34 GW-35 NAME OF LOCATION SULLURUPETA SRIHARIKOTA MEEZURU KATTUVAPALLE KUMMARIPALLEM ELLORE KOGILI JALAPEDDIPALEM DEVUNI KANDRIKA VAKADU SIDDAVARAM VENKANNAPALLEM GOVINDAPALLI MOMIDI PUDIPARTHI INDUPURU ALLURU KOTHAPALEM JUVVALAPALEM THUMMALAPENTA RAMAYAPATNAM AMUDALA PADU NELATURU CHERUVU PYNAPURAM KRISHNAPATNAM NIDIGUNTAPALEM MOLLURU KAPPALATHERUVU BRAHMADEVAM MUTTUKURU EPURE VARAKAVIPUDI PEDDAMAMBATTU KONDURU GOPALAREDDIPALEM B Al Mn mg/L 0.011 0.006 0.002 0.007 0.011 0.005 0.014 0.848 0.987 0.008 0.221 0.555 0.011 0.009 0.011 0.011 0.014 0.023 0.034 0.073 0.013 0.016 0.008 0.009 0.011 0.022 0.009 0.008 0.002 0.007 0.005 0.011 0.016 0.014 0.022 Fe mg/L 0.019 0.005 0.008 0.013 0.014 0.033 0.053 0.265 0.282 0.005 0.022 0.035 0.021 0.005 0.016 0.044 0.016 0.031 0.013 0.017 0.020 0.075 0.002 0.004 0.002 0.002 0.005 0.006 0.019 0.002 0.005 0.005 0.013 0.020 0.033 Cu mg/L 0.007 0.011 0.001 0.008 0.006 0.007 0.002 0.022 0.031 0.003 0.005 0.006 0.005 0.003 0.012 0.023 0.001 0.013 0.007 0.001 0.013 0.011 0.007 0.008 0.007 0.008 0.005 0.008 0.008 0.006 0.005 0.009 0.011 0.007 0.019 Zn mg/L 0.141 0.042 0.017 0.023 0.007 0.034 0.009 0.024 0.737 0.032 0.126 0.362 0.686 0.083 0.045 0.036 0.022 0.045 0.010 0.014 0.013 0.018 0.014 0.011 0.021 0.027 0.013 0.046 0.008 0.007 0.008 0.007 0.005 0.012 0.016 Ag mg/L 0.184 0.187 0.175 0.140 0.225 0.232 0.264 0.123 0.369 0.113 0.150 0.381 0.038 0.022 0.014 0.011 0.007 0.020 0.031 0.059 0.063 0.022 0.145 0.062 0.141 0.081 0.123 0.166 0.202 0.151 0.137 0.113 0.150 0.096 0.143 mg/L 0.008 0.031 0.008 0.013 0.008 0.022 0.030 0.066 0.099 0.006 0.005 0.007 0.005 0.008 0.013 0.015 0.006 0.013 0.004 0.009 0.017 0.010 0.020 0.013 0.016 0.007 0.009 0.008 0.037 0.013 0.013 0.015 0.011 0.013 0.031 mg/L 0.001 <0.001 <0.001 <0.001 <0.001 0.003 <0.001 <0.001 <0.001 <0.001 <0.001 <0.001 <0.001 0.002 0.004 0.005 0.002 0.003 0.003 0.001 0.005 0.001 0.003 <0.001 <0.001 0.004 <0.001 <0.001 <0.001 <0.001 <0.001 <0.001 <0.001 <0.001 <0.001 S.NO 1 2 3 4 5 6 7 8 9 10 11 12 13 14 15 16 17 18 19 20 21 22 23 24 25 26 27 28 29 30 31 32 33 34 35 GROUND WATER UNIT GW-1 GW-2 GW-3 GW-4 GW-5 GW-6 GW-7 GW-8 GW-9 GW-10 GW-11 GW-12 GW-13 GW-14 GW-15 GW-16 GW-17 GW-18 GW-19 GW-20 GW-21 GW-22 GW-23 GW-24 GW-25 GW-26 GW-27 GW-28 GW-29 GW-30 GW-31 GW-32 GW-33 GW-34 GW-35 NAME OF LOCATION SULLURUPETA SRIHARIKOTA MEEZURU KATTUVAPALLE KUMMARIPALLEM ELLORE KOGILI JALAPEDDIPALEM DEVUNI KANDRIKA VAKADU SIDDAVARAM VENKANNAPALLEM GOVINDAPALLI MOMIDI PUDIPARTHI INDUPURU ALLURU KOTHAPALEM JUVVALAPALEM THUMMALAPENTA RAMAYAPATNAM AMUDALA PADU NELATURU CHERUVU PYNAPURAM KRISHNAPATNAM NIDIGUNTAPALEM MOLLURU KAPPALATHERUVU BRAHMADEVAM MUTTUKURU EPURE VARAKAVIPUDI PEDDAMAMBATTU KONDURU GOPALAREDDIPALEM In Ba mg/L 0.342 0.336 0.413 0.413 0.433 0.455 0.455 0.235 0.235 0.287 0.401 0.401 0.228 0.031 0.014 0.028 0.034 0.025 0.282 0.806 0.308 0.044 0.187 0.149 0.220 0.122 0.159 0.177 0.264 0.112 0.156 0.137 0.145 0.137 0.264 Tl Be Mo mg/L 0.007 0.005 0.005 0.005 0.003 0.004 0.005 0.005 0.006 0.006 0.006 0.008 0.005 0.008 0.005 0.004 0.005 0.004 0.007 0.005 0.006 0.003 0.003 0.003 0.001 0.004 0.005 0.002 0.002 0.007 0.003 0.001 0.004 0.001 0.003 Sn Sb mg/L <0.001 <0.001 <0.001 <0.001 <0.001 <0.001 <0.001 <0.001 <0.001 <0.001 <0.001 <0.001 <0.001 <0.001 <0.001 <0.001 <0.001 <0.001 <0.001 <0.001 <0.001 <0.001 <0.001 <0.001 <0.001 <0.001 <0.001 <0.001 <0.001 <0.001 <0.001 <0.001 <0.001 <0.001 <0.001 mg/L <0.001 <0.001 <0.001 <0.001 <0.001 <0.001 <0.001 <0.001 <0.001 <0.001 <0.001 <0.001 <0.001 <0.001 <0.001 <0.001 <0.001 <0.001 <0.001 <0.001 <0.001 <0.001 <0.001 <0.001 <0.001 <0.001 <0.001 <0.001 <0.001 <0.001 <0.001 <0.001 <0.001 <0.001 <0.001 mg/L <0.001 <0.001 <0.001 <0.001 <0.001 <0.001 <0.001 <0.001 <0.001 <0.001 <0.001 <0.001 <0.001 <0.001 <0.001 <0.001 <0.001 <0.001 <0.001 <0.001 <0.001 <0.001 <0.001 <0.001 <0.001 <0.001 <0.001 <0.001 <0.001 <0.001 <0.001 <0.001 <0.001 <0.001 <0.001 mg/L <0.001 <0.001 <0.001 <0.001 <0.001 <0.001 <0.001 <0.001 <0.001 <0.001 <0.001 <0.001 <0.001 <0.001 <0.001 <0.001 <0.001 <0.001 <0.001 <0.001 <0.001 <0.001 <0.001 <0.001 <0.001 <0.001 <0.001 <0.001 <0.001 <0.001 <0.001 <0.001 <0.001 <0.001 <0.001 mg/L <0.001 <0.001 <0.001 <0.001 <0.001 <0.001 <0.001 <0.001 <0.001 <0.001 <0.001 <0.001 <0.001 <0.001 <0.001 <0.001 <0.001 <0.001 <0.001 <0.001 <0.001 <0.001 <0.001 <0.001 <0.001 <0.001 <0.001 <0.001 <0.001 <0.001 <0.001 <0.001 <0.001 <0.001 <0.001 Boron concentrations vary from 0.007 mg/L to 0.381 mg/L in the overall study areas. The maximum concentration of boron has been observed at venkannapallem village. The maximum acceptable limit for boron as per IS: 10500 is 88
Y. V. Rami Reddy et al ______________________________________________________________________________ J. Chem. Pharm. Res., 2013, 5(10):85-90 0.5 mg/L and maximum acceptable limit as per World Health Organization is 2.4 mg/L. However the observed concentration levels of boron in the study area is observed within the acceptable limits given by the IS: 10500 and WHO guidelines. Aluminium concentrations vary from 0.004 mg/L to 0.099 mg/L in the overall study areas. The maximum concentration of Aluminium has been observed at Devuni khandrika village. The permissible limit for aluminium as per IS: 10500 is 0.2 mg/L and maximum guideline value as per World Health Organization is 0.9 mg/L. However the observed concentration levels of aluminium in study area is observed excess of acceptable limits given by the IS: 10500, but within the permissible limit of IS: 10500 and WHO guidelines. Manganese concentrations vary from 0.002 mg/L to 0.987 mg/L in the overall study areas. The maximum concentration of manganese has been observed at Devuni khandrika village. The maximum acceptable limit for manganese as per IS: 10500 is 0.1 mg/L and permissible value 0.3 mg/L and provisional guideline value as per World Health Organization is 0.4 mg/L. The observed manganese values are within the permissible limits given by IS: 10500 and WHO guidelines except three villages named venkannapalem, jalapeddipalem and devuni khandrika villages. Iron concentrations vary from 0.002 mg/L to 0.282 mg/L in the overall study areas. The maximum concentration of iron has been observed at devuni khandrika village. The maximum acceptable limit for iron as per IS: 10500 is 0.3 mg/L and no guideline value is given by World Health Organization for Iron content. However the observed concentration levels of Iron found within the permissible given by the IS: 10500. Copper concentrations vary from 0.001 mg/L to 0.031 mg/L in the overall study areas. The maximum concentration of copper has been observed at Devuni khandrika village. The maximum acceptable limit for copper as per IS: 10500 is 0.05 mg/L and permissible value is 1.5 mg/L and WHO guidelines are 2.0 mg/L. However the observed concentration levels of copper is within the acceptable and permissible limits given by the IS: 10500 and guideline value given by the WHO. Zinc concentrations vary from 0.005 mg/L to 0.737 mg/L in the overall study areas. The maximum concentration of zinc has been observed at Devuni khandrika village. The maximum acceptable limit for zinc as per IS: 10500 is 5.0 mg/L and permissible limit is 15 mg/L and no guideline value given by the World Health Organization. However the observed values are within the permissible and acceptable limit specified in IS: 10500. Silver concentrations vary from <0.001 mg/L to 0.005 mg/L in the overall study areas. The maximum concentration of silver has been observed at ramayapatnam village. The maximum acceptable limit for silver as per IS: 10500 is 0.1 mg/L and there is no guideline value given by World Health Organization. However the observed concentration levels of silver is observed within the permissible limits of IS: 10500. Barium concentrations vary from 0.014 mg/L to 0.806 mg/L in the overall study areas. The maximum concentration of barium has been observed at thummalapenta village. The maximum acceptable limit for barium as per IS: 10500 and WHO guidelines are 0.7 mg/L. However the observed concentration levels of Barium observed within the acceptable limit suggested by IS: 10500 and WHO guidelines expect thummalapenta village. Molybdenum concentrations vary from 0.001 mg/L to 0.008 mg/L in the overall study areas. The maximum concentration of molybdenum has been observed at momidi venkannapallem village. The maximum acceptable limit for molybdenum as per IS: 10500 is 0.07 mg/L and no guideline value has established by the World Health Organization. However the observed concentration levels of Molybdenum is observed within the acceptable limits suggested in IS: 10500. Indium, Thallium, beryllium, Tin, Antimony concentration levels has been observed <0.001 mg/L. in overall study area. CONCLUSION Ground water is one of the major important drinking water sources in throughout the world. Especially in most of the village areas the public are using ground water for drinking purpose. Metals are most considerable contaminants in ground water. Excess levels of metals might be cause several short term and long term health effects to the human beings. Determination of these metals with high accuracy and precision at trace levels is one of the major challenges in analytical chemistry. ICP-MS is one of the most widely and universally using technique for determination of metals upto trace levels. The present study is focussed on determination of 14 metals like Beryllium (Be), Boron 89
Y. V. Rami Reddy et al ______________________________________________________________________________ J. Chem. Pharm. Res., 2013, 5(10):85-90 (B), Aluminium (Al), Antimony (Sb), Tin (Sn), Manganese (Mn), Molybdenum (Mo), Iron (Fe), Copper (Cu), Zinc (Zn), Indium (In), Barium (Ba), Thallium (Tl), and Silver (Ag) in coastal surrounding villages of SPSR Nellore district. For this study 35 ground water samples are collected and subjected to analyze for Be, B, Al, Sb, Sn, Mn, Mo, Fe, Cu, Zn, In, Ba, Tl and Ag by using Inductively Coupled Plasma–Mass Spectrometry (ICP-MS) technique. The minimum and maximum concentration levels of these 14 metals are summarized and discussed in the results and discussion and the concentrations of these 14 metal levels in the study area were compared with drinking water quality standards given by the Indian Standards (IS : 10500) and World Health Organization (WHO), 4th edition in 2011. In the overall study area the concentration levels of some of the metals are exceed the accepted limits suggested by IS: 10500, but observed within the permissible limits of IS: 10500 except the manganese concentration is exceeded the WHO and IS: 10500 suggested limits in three villages named by venkannapalem, jalapeddipalem and devuni khandrika villages and barium concentration levels in thummalapenta village. There should be some treatment required to control the manganese and barium concentrations in above suggested villages and also the study suggest to adopt the some controlling technologies to control the other metal concentration in the ground water in the study area to provide safe and metal free drinking water to the villagers. REFERENCES [1]P M N Prasad; Y V Rami Reddy. TIDEE (TERI Information Digest on Energy and Environment), 2011, Volume 10, Number 2. [2]J A Omolaoye; A Uzairu; C E Gimba. Archives of Applied Science Research, 2010, 2 (5), 76-84. [3]E P Nardi; F S Evangelista; L Tormen; T D Saint Pierre; A J Curtius; S Sd Souza; F Barbosa. Jr., Food Chem, 2009, 112, 727– 732. [4]UNESCO. Ground Water Pollution. International Hydrological Programme. 2000. Guidelines for drinking water quality, 2011, 4th edition, WHO. [5]P O Agbaire; I P Oyibo. African Journal of Pure and Applied Chemistry, 2009, 3 (6), pp.116–118. [6]C Sadashivaiah; C R Ramakrishnaiah; G Ranganna. Int. J. Environ. Res. Public Health,2008, 5(3), 158–164. [7]I M Adekunle; M T Adetunji; A M Gbadebo; O BBanjoko. Int. J. Environ. Res. Public Health,2007, 4(4), 307– 318. [8]S Basavaraja; S M Hiremath; K N S Murthy; F N Chandrashekarappa; A N Patel; E T Puttiah. India Global Journal of Science Frontier Research, 2011, 11(3). [9]E E Ogabiela; E M Okwonkwo; A D Oklo; U U Udiba; C Hammuel; A F Ade-Ajayi. Journal of Applied Environmental and Biological Sciences, 2011, 1(6), pp 96-100. [10]M O Aremu; G N Ozonyia; P P Ikokoh. Electronic journal of Environmental Agriculturaland Food Chemistry, 2011, 10(6), 2296-2304. [11]Ramakrishnaiah; C R C Sadashivaiah; G Ranganna. India. J.Chem, 2009, 6, 523-530. [12]A Ranjana. Study of physic-chemical parameters of ground water quality of dud town in Rajasthan. J., 2009, 2, 969-971. [13]M A Momudu and C A Anyakora. Res. J. Enviro. Earth. Sci., 2010, 2, 39-43. [14]D F Singh, Proc Acad Environ Biol,. 1992, 1 (1), 61-66. [15]T N Tiwari and M A Mishra, Indian J Environ Proc., 1985, 5, 276-279. [16]P C Mishra and R K Patel, Indian J Environ Ecoplan, 2001, 5(2), 293-298. [17]S Naik and K M Purohit, Indian J Environ Ecoplan, 2001, 5(2), 397--402. 90