Download
1 / 6
60 likes | 80 Vues
Agricultural Geography is mainly concerned with the spatio temporal analysis of agricultural activities. The most striking characteristic feature of the present day agriculture is its great diversity of practice, products and organisation Grigg, D. 1969 . The bewildering diversity of agricultural practices and pattern of crop farming is due to diversity in topographical, agro climatic, cultural, socio economic and technological conditions Ramanaiah, Y.V., 1984 . A systematic study of crop land relationship not only helps agricultural regionalisation but also provides a scientific basis for land resource allocation to various agricultural crops and planning for maximum productivity Singh and Singh, 1970 . The spatial patterns and dynamics of cropland utilisation in agriculture have received due importance in the field of agricultural geography. The study of cropping pattern or crop land relationship helps to develop typology and taxonomy of agriculture. Hence in the present study an endeavour is made to study the changing spatial patterns of general crops in Nellore District, Andhra Pradesh for two trienniums i.e., 1987 90 and 2012 15 taking Mandal as unit. N. Bala Ankanna | A. Krishna Kumari "Changing Patterns of General Crops in Nellore District, Andhra Pradesh" Published in International Journal of Trend in Scientific Research and Development (ijtsrd), ISSN: 2456-6470, Volume-3 | Issue-6 , October 2019, URL: https://www.ijtsrd.com/papers/ijtsrd28055.pdf Paper URL: https://www.ijtsrd.com/humanities-and-the-arts/geography/28055/changing-patterns-of-general-crops-in-nellore-district-andhra-pradesh/n-bala-ankanna<br>

E N D
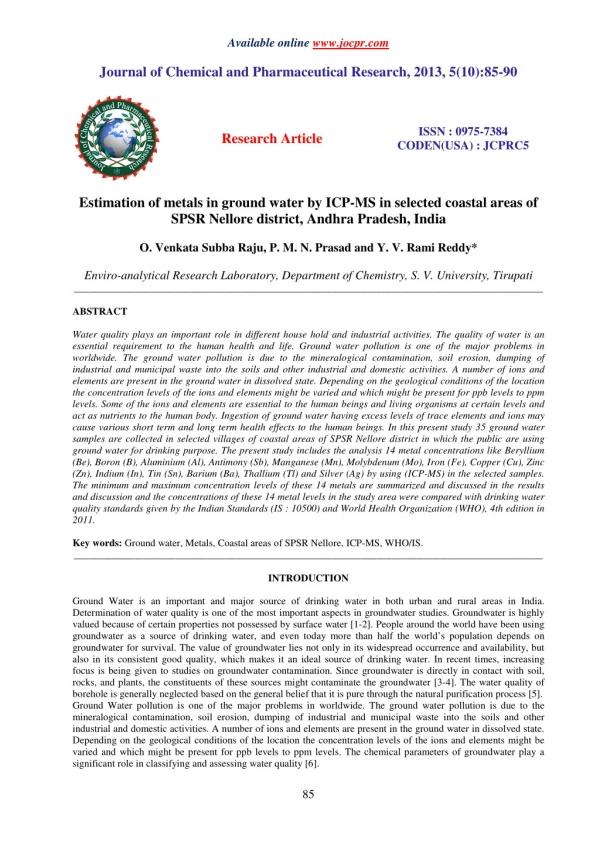
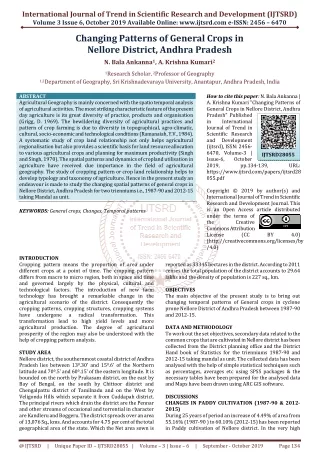
International Journal of Trend in Scientific Research and Development (IJTSRD) Volume 3 Issue 6, October 2019 Available Online: www.ijtsrd.com e-ISSN: 2456 – 6470 Changing Patterns of General Crops in Nellore District, Andhra Pradesh N. Bala Ankanna1, A. Krishna Kumari2 1Research Scholar, 2Professor of Geography 1,2Department of Geography, Sri Krishnadevaraya University, Anantapur, Andhra Pradesh, India ABSTRACT Agricultural Geography is mainly concerned with the spatio temporal analysis of agricultural activities. The most striking characteristic feature of the present day agriculture is its great diversity of practice, products and organisation (Grigg, D. 1969). The bewildering diversity of agricultural practices and pattern of crop farming is due to diversity in topographical, agro-climatic, cultural, socio-economic and technological conditions (Ramanaiah, Y.V., 1984). A systematic study of crop land relationship not only helps agricultural regionalisation but also provides a scientific basis for land resource allocation to various agricultural crops and planning for maximum productivity (Singh and Singh, 1970). The spatial patterns and dynamics of cropland utilisation in agriculture have received due importance in the field of agricultural geography. The study of cropping pattern or crop land relationship helps to develop typology and taxonomy of agriculture. Hence in the present study an endeavour is made to study the changing spatial patterns of general crops in Nellore District, Andhra Pradesh for two trienniums i.e., 1987-90 and 2012-15 taking Mandal as unit. KEYWORDS: General crops, Changes, Temporal patterns INTRODUCTION Cropping pattern means the proportion of area under different crops at a point of time. The cropping pattern differs from macro to micro region, both in space and time and governed largely by the physical, cultural and technological factors. The introduction of new farm technology has brought a remarkable change in the agricultural scenario of the district. Consequently the cropping patterns, cropping structures, cropping systems have undergone a radical transformation. transformation lead to high yield levels and more agricultural production. The degree of agricultural prosperity of the region may also be understood with the help of cropping pattern analysis. STUDY AREA Nellore district, the southernmost coastal district ofAndhra Pradesh lies between 130.30' and 150.6' of the Northern latitude and 700.5' and 600.15' of the eastern longitude. Itis bounded on the north by Prakasam district, on the east by Bay of Bengal, on the south by Chittoor district and Chengalpattu district of Tamilnadu and on the West by Veligonda Hills which separate it from Cuddapah district. The principal rivers which drain the district are the Pennar and other streams of occasional and torrential in character are Kandleru and Boggeru. The district spreads over an area of 13,076 Sq., kms. And accounts for 4.75 per cent of the total geographical area of the state. Which the Net area sown is How to cite this paper: N. Bala Ankanna | A. Krishna Kumari "Changing Patterns of General Crops in Nellore District, Andhra Pradesh" Published in International Journal of Trend in Scientific Research and Development (ijtsrd), ISSN: 2456- 6470, Volume-3 | Issue-6, October 2019, pp.134-139, https://www.ijtsrd.com/papers/ijtsrd28 055.pdf Copyright © 2019 by author(s) and International Journal of Trend in Scientific Research and Development Journal. This is an Open Access article distributed under the terms of the Creative Commons Attribution License (CC (http://creativecommons.org/licenses/by /4.0) IJTSRD28055 URL: BY 4.0) reported as 33345 hectares in the district. According to 2011 censes the total population of the district accounts to 29.64 lakhs and the density of population is 227 sq., km. OBJECTIVES The main objective of the present study is to bring out changing temporal patterns of General crops in cyclone prone Nellore District of Andhra Pradesh between 1987-90 and 2012-15. DATA AND METHODOLOGY To work out the set objectives, secondary data related to the common crops that are cultivated in Nellore district has been collected from the District planning office and the District Hand book of Statistics for the trienniums 1987-90 and 2012-15 taking mandal as unit. The collected data has been analysed with the help of simple statistical techniques such as percentages, averages etc using SPSS packages & the necessary tables have been prepared for the analysed data and Maps have been drawn using ARC GIS software. DISCUSSIONS CHANGES IN PADDY CULTIVATION (1987-90 & 2012- 2015) During 25 years of period an increase of 4.49% of area from 55.16% (1987-90 ) to 60.10% (2012-15) has been reported in Paddy cultivation of Nellore district. In the very high This @ IJTSRD | Unique Paper ID – IJTSRD28055 | Volume – 3 | Issue – 6 | September - October 2019 Page 134
International Journal of Trend in Scientific Research and Development (IJTSRD) @ www.ijtsrd.com eISSN: 2456-6470 concentration zones ( >80%), the number of mandals have been increased from 8 to 12 mandals where as in high concentration (60-80%), medium concentration (40-60%) and low concentration (20-40%), the number of mandals have been decreased (Table-4.2). Again there is an increase of 2 mandals in the very low concentration (<20%) zone. Change is also observed in the highest concentration of paddy cultivated mandals i.e., (Allur mandal in 1987-90 and Kodavalur mandal in 2012-15). No change is noticed in the lowest concentration areas (Table-1). CHANGES IN GROUNDNUT CULTIVATION (1987-90 & 2012-15) Significant decrease (8.33%) of Groundnut cropped area has been observed in Nellore district in 25 years period i.e., from 1987-90 & 2012-15. Very high(>35%) and high (25-35%) concentration zones have been completely vanished during 25 years period. These zones have been replaced with low(5- 15%) and very low (< 5 %) concentration zones. Two mandals (Kovur & Gudur) have been identified as zero Groundnut cultivation areas. During the 25 years period, the mandals of maximum and minimum concentrations also changed both at area wise and location wise (Table-1). CHANGES IN JOWAR CULTIVATION (1987-90 & 2012-15) Remarkable shrinkage of 7.18% of area has been noticed in jowar cultivation during the study period in Nellore district. High (>20%) and moderate (10-20%) concentration zones have been completely disappeared during 2012-15, compared to 1987-90. i.e., during 25 years period. The number of mandals in low (<10%) concentration zone also shrinked to 14 from 22 mandals. Zero cultivation mandals have been increased to 32 from 13 mandals. The maximum and minimum concentration mandals of jowar cultivation is also changed during the study period both area wise and location wise (Table-1). TABLE-1 CHANGES PATTERN OF PADDY CULTIVATION -NELLORE DISTRICT Concentration of Area under Paddy cultivation 1987-90 >80 % 8 60-80 % 17 40-60 % 8 20-40 % 7 <20 % 6 Allur (95.78%) Duttalur (7.36%) District Total 55.16% No of Mandals S No 1 2 3 4 5 Decrease/Increase in 25 years period +4 -2 -3 -1 +2 Change occurred both area wise and location wise Change occurred in percentage of area and no change locationally +4.94% 2012-15 12 15 5 6 8 Kodavalur (98.40%) Duttalur (6.68%) 60.10% 6 Maximum 7 Minimum 8 CHANGES PATTERN OF GROUNDNUT CULTIVATION- NELLORE DISTRICT Concentration of Area under Groundnut cultivation 1 >35 % 2 25-35 % 3 15-25 % 4 5-15 % 5 <5 % 6 Zero No of Mandals Decrease/Increase in 25 years period -4 -3 -9 +4 +10 +2 Change occurred both area wise and location wise Change occurred both area wise and location wise - 8.33 S No 1987-90 4 3 11 10 18 NIL Seetharamapuram (48.92%) 2012-15 NIL NIL 2 14 28 2 Venkatagiri (22.38%) 7 Maximum 8 Minimum Allur (0.89%) Manubolu (0.02%) 9 District Total 12.35% 4.02% CHANGES PATTERN OF JOWAR CULTIVATION- NELLORE DISTRICT S No under Jowar cultivation 1 >20 % 2 10-20 % 3 <10 % 4 Zero % No of Mandals Concentration of Area Decrease/Increase in 25 years period -6 -5 -8 +19 Change occurred both area wise and location wise Change occurred both area wise and location wise -7.18% 1987-90 6 5 22 13 2012-15 NIL NIL 14 32 5 Maximum Kaluvoya (44.03%) Udayagiri (5.6%) Indukurpet, 6 Minimum Vinjamur (0.03%) Thotapalligudur (0.01%) 7.50 % 7 District Total 0.32 % CHANGES IN FRUIT CROPS CULTIVATION (1987-90 & 2012-15) Progressive expansion in Fruit farming has been noticed in Nellore district during the study period. In more than 50% of the mandals high (>10%) to moderate (5-10%) concentration of fruit cultivation has been reported in 2012-15, compared to only @ IJTSRD | Unique Paper ID – IJTSRD28055 | Volume – 3 | Issue – 6 | September - October 2019 Page 135
International Journal of Trend in Scientific Research and Development (IJTSRD) @ www.ijtsrd.com eISSN: 2456-6470 23% of the mandals in 1987-90. A variety of fruit crops have been gaining ground replacing Millet crops in the district. Changes have been occurred in the highest concentration mandals both aerially and locationally. Regarding to lowest concentration mandals no change is observed (Table-2). CHANGES IN PULSES & GRAMS CULTIVATION (1987-90 & 202-15) Significant increase is observed in Pulses and Grams cultivation in Nellore district during 25 years period. An increase of 4.21% of area is observed during the study period. The number of mandals under high concentration have been spread from 2 mandals (1987-90) to 11 mandals (2012-15). Additionally in about 9 mandals Pulses and Grams cultivation has been noticed in 25 years period. Decrease in the number of mandals also have been observed in medium, low concentrations and Zero cultivation areas. Change is also occurred in the highest and lowest concentration mandals both area wise and location wise (Table-2). CHANGES IN TOBACCO CULTIVATION (1987-90 & 2012-15) During 25 years period there is an increase of 0.94% of area under Tobacco cultivation in Nellore district. Marripadu, Kaligiri, Duttalur and Atmakur have been retained as high (>10%) concentration mandals of Tobacco cultivation both in 1987-90 & 2012-15. The same trend has been observed even in the moderate concentration zone (5-10%), i.e., Kondapuram,Vinjamur and Anumasamudrampeta mandals remained under moderate concentration zone. The number of low (<5%) concentration mandals have been reduced to half and there is an increase of 7 mandals in Zero Tobacco cultivation mandals (Table-2). With regard to highest concentration mandal Marripadu topped in both the years, but there is an increase in the cultivated area during 25 years period. Regarding to lowest concentration mandals, change has been occurred both at area level and location. TABLE-2 CHANGES PATTERN OF FRUITS CULTIVATION - NELLORE DISTRICT S No under Fruits cultivation 1987-90 1 >10 % 8 2 5-10 % 3 3 <5 % 35 No of Mandals Concentration of Area Decrease/Increase in 25 years period +8 +6 -14 Change occurred both area wise and location wise Change occurred in area and no change locationally + 5.26 % 2012-15 16 9 21 4 Maximum Sydapuram (26.35%) Rapur (55.30%) 5 Minimum Kodavalur (0.20%) Kodavalur (0.18%) 6 District Total 3.8 % 9.06 % CHANGES PATTERN OF PULSES & GRAMS CULTIVATION- NELLORE DISTRICT S No Pulses & grams cultivation 1 >10 % 2 5-10 % 3 <5 % 4 Zero % No of Mandals 1987-90 2 7 26 11 Chejerla (11.47%) Manubolu (0.08%) 2.6% Concentration on of Area under Decrease/Increase in 25 years period +9 -2 -6 -1 Change occurred both area wise and location wise Change occurred both area wise and location wise + 4.21% 2012-15 11 5 20 10 Vinjamur (43.39%) Thotapalligudur (0.35%) 6.81% 5 Maximum 6 Minimum 7 District Total CHANGES PATTERN OF TOBACCO CULTIVATION- NELLORE DISTRICT S No under Tobacco cultivation 1 >10 % 2 5-10 % 3 <5 % 4 Zero % No of Mandals Concentration of Area Decrease/Increase in 25 years period NIL NIL +7 +7 Change occurred in area and no change locationally Change occurred both area wise and location wise + 0.94% 1987-90 4 3 14 25 2012-15 4 3 7 32 5 Maximum Marripadu (22.38%) Marripadu (37.36%) 6 Minimum Rapur (0.07%) Dagadarthi (0.28%) 7 District Total 2.07% 3.01% CHANGES IN BAJRA CULTIVATION (1987-90 & 2012-15) Significant changes have been observed in Bajra cultivation during 25 years of period. The high concentration zone has been shrinked to one mandal in 2012-15 from 3 mandals in 1987-90. The same trend is noticed in moderate concentration zone too. Contraction of about 15 mandals is reported under low concentration zone (Table-3). Remarkable increase of zero Bajra cultivated areas is also found during 25 years of period. Change has also been occurred both at area and location of highest and lowest concentration mandals. @ IJTSRD | Unique Paper ID – IJTSRD28055 | Volume – 3 | Issue – 6 | September - October 2019 Page 136
International Journal of Trend in Scientific Research and Development (IJTSRD) @ www.ijtsrd.com eISSN: 2456-6470 CHANGES IN SPICES AND CONDIMENTS CULTVATION (1987-90 & 2012-15) In Nellore district, during 25 years of period a significant amount of area has been decreased under Spices and Condiments cultivation. About 1.2% of area is decreased in the district during 25 years of period. Absolute absence of high (>6%) and moderate (3-6%) concentration zones of Spices and Condiments is reported during 25 years of period. Decrease in the number of mandals is also observed in low (<3%) concentration zone. In turn this decrease has been shifted to zero cultivated zone of Spices and Condiments which appeared as an additional zone after 25years period (Table-3). Change is also observed in highest and lowest concentration mandals both at area and location. CHANGES IN RAGI CULTIVATION (1987-90 & 2012-15) Remarkable shrinkage of area has been noticed in Ragi cultivation during the study period in Nellore district. High (>10%) and medium (5-10%) concentration zones have been completely disappeared during 2012-15 compared to 1987-90. The number of mandals in low concentration (<5%) zone also shrinked to 9 mandals from 34 mandals. Zero cultivation mandals have been increased to 37 from 7 mandals. The maximum and minimum concentration of Ragi cultivation also changed during the study period both area wise and location wise (Table-3). TABLE-3 CHANGES PATTERN OF BAJRA CULTIVATION - NELLORE DISTRICT S No under Bajra cultivation 1987-90 1 >10 % 3 2 5-10 % 5 3 <5 % 29 4 Zero % 9 Duttalur (13.56%) Thotapalligudur (0.01%) 7 District Total 1.58% CHANGES PATTERNS OF SPICES & CONDIMENTS CULTIVATION - NELLORE DISTRICT S No Spices & Condiments cultivation 1987-90 1 >6 % 4 2 3-6 % 6 3 <3 % 36 4 Zero % NIL Kaligiri (8.81%) Allur (0.06%) 7 District Total 1.57% CHANGES PATTERN OF RAGI CULTIVATION- NELLORE DISTRICT S No under Ragi cultivation 1987-90 1 >10 % 3 2 5-10 % 2 3 <5 % 34 4 Zero % 7 Duttalur (11.23%) Indukurpet, Podalakur & Ozili (0.01%) 7 District Total 1.32% CHANGES IN VEGETABLES CULTIVATION (1987-90 & 2012-15) Significant decrease of 0.81% vegetable crop cultivation area has been observed in Nellore district in 25 years period i.e., from 1987-90 and 2012-15. The high (>2%) concentration zone has been increased to 5 mandals in 2012-15 from 2 mandals in 1987-90. The same trend is noticed in moderate (1-2%) concentration zone too i.e., 3 mandals in 2012-15 from 2 mandals in 1987-90. About 32 mandals are reported under low (<1%) concentration zone (Table-4). Remarkable decrease in Zero vegetable crop cultivated areas is also found during 25 years of period. Change has also been occurred both in area and location of the highest and lowest concentration mandals. No of Mandals Concentration of Area Decrease/Increase in 25 years period -2 -4 -15 +21 Change occurred both area wise and location wise Change occurred both area wise and location wise -1.28% 2012-15 1 1 14 30 Seetharamapuram (10.28%) Sullurpeta (0.05%) 0.30% 5 Maximum 6 Minimum No of Mandals Concentration of Area under Decrease/Increase in 25 years period -4 -6 -8 +18 Change occurred both area wise and location wise Change occurred both area wise and location wise -1.2% 2012-15 NIL NIL 28 18 Udayagiri (2.83%) Jaladanki (0.03%) 0.37% 5 Maximum 6 Minimum No of Mandals Concentration of Area Decrease/Increase in 25 years period -3 -2 -25 +30 Change occurred both area wise and location wise Change occurred both area wise and location wise -1.3% 2012-15 NIL NIL 9 37 Seetharamapuram (0.68%) Kavali & Vinjamur (0.02%) 0.02% 5 Maximum 6 Minimum @ IJTSRD | Unique Paper ID – IJTSRD28055 | Volume – 3 | Issue – 6 | September - October 2019 Page 137
International Journal of Trend in Scientific Research and Development (IJTSRD) @ www.ijtsrd.com eISSN: 2456-6470 CHANGES IN SUGARCANE CULTIVATION (1987-90 & 2012-15) Substantial increase of 2.7% of area has been reported in 25 years period in Sugarcane cultivated area. The zone of high (>10%) concentration has been expanded with 4 more mandals such as Sangam, Vinjamur, Chittamur and Podalakur in 2012- 15 apart from the existing mandals in 1987-90 i.e., Buchireddipalem and Kovur. The moderate (5-10%) and Low (<5%) concentration zones are also been expanded during 25 years period. The expansion has been substituted with the decrease of mandals in zero cropped areas of Sugarcane (Table-4). Buchireddipalem is remained as the highest concentration mandal of Sugarcane cultivated area both in 1987-90 & 2012-15. This may be due to the proximity of the Kovur Sugar Mill near to Buchireddipalem, which facilitate the marketing of sugarcane. Locational change has been occurred regarding to the minimum concentration mandals during 25 years period i.e., Allur and Pellakur have been replaced by Kodavalur as lowest concentration mandal of Sugarcane cultivation. CHANGES IN COTTON CULTIVATION (1987-90 & 2012-15) In Nellore district an increase of 0.81% of area has been reported during 25 years period. The high (>4%) concentration zone at mandal level has been expanded from 3 to 7 mandals during the study period. There is an increase of 2 mandals regarding to moderate (2-4%) concentration. The slight decrease of 2 mandals is reported in low (<2%) concentration zone and the decrease of 4 mandals in zero cropped area (Table-4). Atmakur has been noticed as highest concentration mandal of cotton cultivation in 2012-15 against Buchireddipalem in 1987-90. Udayagiri mandal is remained as the lowest concentration mandal in both the Trienniums i.e., 1987-90 and 2012 -15. TABLE-4 CHANGES PATTERNS OF VEGETABLES CULTIVATION- NELLORE DISTRICT S No Vegetables cultivation 1987-90 1 >2 % 2 2 1-2 % 2 3 <1 % 32 4 Zero % 10 Kaligiri (3.24%) Allur (0.06%) 7 District Total 1.01% CHANGES IN SUGARCANE CULTIVATION -NELLORE DISTRICT S No under Sugarcane cultivation 1987-90 1 >10 % 2 2 5-10 % 1 3 <5 % 14 4 Zero % 29 Buchireddipalem (14.90%) Allur & Pellakur (0.03%) 7 District Total 1.0% CHANGES PATTERN OF COTTON CULTIVATION- NELLORE DISTRICT S No under Cotton cultivation 1987-90 1 >4 % 3 2 2-4 % 4 3 <2 % 17 4 Zero % 22 Buchireddypalem (5.95%) Udayagiri (0.04%) 7 District Total 1.00 % No of Mandals Concentration of Area under Decrease/Increase in 25 years period +3 +1 0 -4 Change occurred both area wise and location wise Change occurred both area wise and location wise - 0.18% 2012-15 5 3 32 6 Ananthasagaram (7.09%) Sullurpeta (0.02%) 0.83% 5 Maximum 6 Minimum No of Mandals Concentration of Area Decrease/Increase in 25 years period +4 +3 +14 -21 Change occurred in area and no change locationally Change occurred both area wise and location wise - 0.18% 2012-15 6 4 28 8 Buchireddipalem (18.77%) Kodavalur (0.09%) 3.79% 5 Maximum 6 Minimum No of Mandals Concentration of Area Decrease/Increase in 25 years period 2012-15 7 6 15 18 Atmakur (10.21%) Udayagiri (0.06%) 1.81% +4 +2 -2 -4 Change occurred both area wise and location wise Change occurred in area and no change locationally + 0.81% 5 Maximum 6 Minimum @ IJTSRD | Unique Paper ID – IJTSRD28055 | Volume – 3 | Issue – 6 | September - October 2019 Page 138
International Journal of Trend in Scientific Research and Development (IJTSRD) @ www.ijtsrd.com eISSN: 2456-6470 CONCLUSION As a concluding remark, the general cropping pattern in Nellore district has under gone remarkable changes especially in certain crop concentrations. Increase in cultivated areas has been observed in Fruit crops (+5.26%), Paddy (+4.94%), Pulses & Grams (+4.21%), Sugarcane (+2.79%), Tobacco (+0.94%) and Cotton (+0.81%) during25 years period. Whereas decrease in the crop cultivated areas has been noticed in Groundnut (-8.3%), Jowar (-9.18%), Ragi (-1.3%), Bajra (-1.28%), Spices & Condiments ( -1.2%) and Vegetable crops (-0.18%) during the study period in Nellore district. This study reveals that the Millet crops are losing ground in Nellore district substituting the Fruit crops in particular (Table-5). TABLE-5 PERCENTAGES OF GENERAL CROPPING PATTERN IN NELLORE DISTRICT PERCENTAGE TO TOTAL CROPPED AREA 1987-90 1 Paddy 55.16 2 Groundnut 12.35 3 Jowar 7.49 4 Fruit crops 3.80 5 Pulses & Grams 2.60 6 Tobacco 2.07 7 Bajra 1.58 8 Spices & condiments 1.57 9 Ragi 1.32 10 Vegetables 1.01 11 Sugarcane 1.00 12 Cotton 1.00 13 Miscellaneous 9.10 District Total 100 REFERENCES [1]Grigg, David: 1967 The Agricultural regions of the World Review and Reflections, Economic Geography, Vol, 45, No, 2, Pp 95-132. S. No CROP INCREASE/DECREASE IN 25 YEARS 2012-15 60.10 4.02 0.36 9.06 6.81 3.01 0.30 0.37 0.02 0.83 3.79 1.81 9.54 100 +4.94 -8.33 -7.18 +5.26 +4.21 +0.94 -1.28 -1.2 -1.3 -0.18 +2.79 +0.81 0.44 - Efficiency in Papanasam Taluk, Tanjavur District, Tamilnadu, India”, Recent Research in Science and Technology. [6]Aloka Kumar Goyal and Dr. Sandeep Kumar (2013): “Agricultural production Trends and Cropping pattern in Uttar Pradesh: An Over view”, International journal of Agricultural innovations and Research, Vo.2, Issue 2, Pp.229-235. [2]Ramanaiah, Y. V. (1984) Pattern of Land use and Cropping in Andhra Pradesh, an unpublished Ph.D. Thesis Dept. of Geography, S.V. University, Tirupati. [3]Sing, J. and Dilhon, S.S, 2005. Agricultural geography. New Delhi: Tata McGraw Hill. [7]Aggarwal, R. K (2013): “Effect of Rainfall on Cropping Pattern in Himalayan Region”, African Journal of Environmental Science And Technology”, Vol. 7 (7), Pp. 634-640. [4]Sing, K. N and Singh, B (1970): Landuse, Cropping Pattern and their ranking in Shahganj Tahisil: A Geographical analysis, The National Geographical Journal of India, Vol, XVI, P. 221-225. [8]Kanwar, J. s. (1972): “Cropping patterns, Scope and Concept, Symposium on Cropping Pattern in India”, ICAR, New Delhi. [5]Punithavathi, J and Baskaran, R. (2010) : “Changes in the Cropping Pattern, Crop concentration, Agricultural @ IJTSRD | Unique Paper ID – IJTSRD28055 | Volume – 3 | Issue – 6 | September - October 2019 Page 139