Estimation of Various Population Parameters Point Estimation and Confidence Intervals
200 likes | 297 Vues
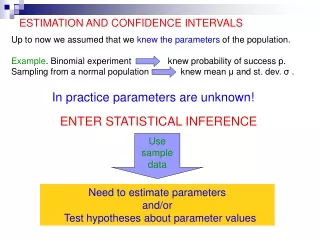
Learn about point estimation and confidence intervals for population parameters, including example calculations and interpretations. Understand key statistical terms and methods in inferential statistics.

Estimation of Various Population Parameters Point Estimation and Confidence Intervals
E N D
Presentation Transcript
Estimation of Various Population ParametersPoint Estimation and Confidence Intervals Dr. M. H. Rahbar Professor of Biostatistics Department of Epidemiology Director, Data Coordinating Center College of Human Medicine Michigan State University
Important Statistical Terms • Population: A set which includes all measurements of interest to the researcher • Sample: Any subset of the population • Parameter of interest: Characteristics of interest in a population are called population parameters • (e.g, mean, standard deviation, proportion)
Inferential Statistics • Estimation includes point and interval estimation of population parameters • Mean = • Median • Standard deviation = • Proportion = p • Incidence
Central Limit Theorem • When large samples, (n>30), are selected from a population with mean and standard deviation , then • the sampling distribution of the sample mean is approximately normal with the same mean , and the standard error, SE=
Estimation of Population Mean A 95% confidence interval for based on a large sample, when n>30, is approximately,
Estimation of Population Mean A (1- )100% confidence interval for based on a large sample, when n>30, is approximately,
Example # 1 Suppose we want to estimate the average birth-weight of children born to non-smoking women in community X. Assume the standard deviation of birth-weights is 0.5 Kg and the sample mean birth-weight is 3.0 Kg. Find a 95% confidence interval for .
Interpretation of CI’s What do we mean by (2.9 Kg, 3.1 Kg) is a 95% CI for the mean birth-weight of children born to non-smoking women in community X? Does interval (2.9 , 3.1) contain ?
Confidence Interval for P Suppose we want to estimate the prevalence of hypertension among adults in community X. Assume in a random sample of 100 adults from this community the prevalence of hypertension is 0.50. Find a 95% confidence interval for P.
Probability vs Odds of an Event • An experiment is repeated for a large number of times. Then the probability of occurrence of an event E is the percentage of the time that that particular event has occurred in repeated experiments. • Suppose P(E)=0.40 • Odds of an event E =P(E)/{1-P(E)}. Example, If P(E)=0.40, then Odds of E=2/3.
In the following contingency table estimate the proportion and odds of drinkers among those who develop Lung Cancer and those without the disease?
Odds Ratio as a Measure of Association • Odds Ratio=ad/bc • OR=1.67 • This means that the odds of drinking among cases is 67% more than the odds of drinking among controls. • QUESTION: Is there a difference in the proportion of drinkers among those who develop Lung Cancer and those without the disease?
Relative Risk as Measure of Association Risk among exposed = a/(a+b) Risk among non-exposed = c/(c+d) Relative Risk = Risk among exposed relative to risk among non-exposed • QUESTION: Are persons exposed to “factor X” more likely to develop the disease than those not so exposed?
QUESTION: Are persons exposed to “factor X” more likely to develop the disease than those not so exposed? Risk among exposed = a/(a+b)=33/60=0.55 Risk among non-exposed = c/(c+d)=1667/3940=0.42 Relative Risk = Risk among exposed relative to risk among non-exposed RR=1.31
95% Confidence Intervals for Odds Ratios and Relative Risk • NOTE: • Confidence Intervals for Odds Ratios and Relative Risk are not symmetrical • Odds Ratio=ad/bc • OR=1.67 • E.g., 95% CI for OR (1.2, 2.9) • If the 95% CI for OR does not include one then we conclude a difference in the odds of drinking between the two groups • We use Statistical packages to calculate the CI’s for OR or RR
QUESTION: Estimate the difference between the proportions of drinkers among Lung Cancer cases and controls!
QUESTION: Estimate the difference between the mean blood levels of cases and controls?
Factors influencing the width of the CI’s Sample size Variance Confidence level = (1-)100%
Width of the CI’s If Sample size =n , then Width If Variance , then Width If Confidence level , then Width