Estimation and Confidence Intervals
390 likes | 665 Vues
Estimation and Confidence Intervals. Point and Interval Estimates. A point estimate is the statistic (single value), computed from sample information, which is used to estimate the population parameter.

Estimation and Confidence Intervals
E N D
Presentation Transcript
Point and Interval Estimates • A point estimate is the statistic (single value), computed from sample information, which is used to estimate the population parameter. • A confidence interval estimate is a range of values constructed from sample data so that the population parameter is likely to occur within that range at a specified probability. The specified probability is called the level of confidence.
Factors Affecting Confidence Interval Estimates The factors that determine the width of a confidence interval are: 1.The sample size, n. 2.The variability in the population σ, usually estimated by s. 3.The desired level of confidence.
Finding z-value for 95% Confidence Interval The area between Z = -1.96 and z= +1.96 is 0.95
Interval Estimates - Interpretation For a 95% confidence interval about 95% of the similarly constructed intervals will contain the parameter being estimated. Also 95% of the sample means for a specified sample size will lie within 1.96 standard deviations of the hypothesized population
Characteristics of the t-distribution 1. It is, like the z distribution, a continuous distribution. 2. It is, like the z distribution, bell-shaped and symmetrical. 3. There is not one t distribution, but rather a family of t distributions. All t distributions have a mean of 0, but their standard deviations differ according to the sample size, n. 4. The t distribution is more spread out and flatter at the center than the standard normal distribution As the sample size increases, however, the t distribution approaches the standard normal distribution,
Comparing the z and t Distributions when n is small, 95% Confidence Level
When to Use the z or t Distribution for Confidence Interval Computation
Selecting a Sample Size (n) There are 3 factors that determine the size of a sample, none of which has any direct relationship to the size of the population. They are: • The degree of confidence selected. • The maximum allowable error. • The variation in the population.
Sample Size Determination for a Variable • To find the sample size for a variable:
Sample Size Determination for a Variable-Example 1 A student in public administration wants to determine the mean amount members of city councils in large cities earn per month as remuneration for being a council member. The error in estimating the mean is to be less than $100 with a 95 percent level of confidence. The student found a report by the Department of Labor that estimated the standard deviation to be $1,000. What is the required sample size? Given in the problem: • E, the maximum allowable error, is $100 • The value of z for a 95 percent level of confidence is 1.96, • The estimate of the standard deviation is $1,000.
Sample Size Determination for a Variable-Example 2 A student in public administration wants to determine the mean amount members of city councils in large cities earn per month as remuneration for being a council member. The error in estimating the mean is to be less than $100 with a 99 percent level of confidence. The student found a report by the Department of Labor that estimated the standard deviation to be $1,000. What is the required sample size? Given in the problem: • E, the maximum allowable error, is $100 • The value of z for a 99 percent level of confidence is 2.58, • The estimate of the standard deviation is $1,000.
Sample Size for Proportions • The formula for determining the sample size in the case of a proportion is:
Another Example The AK Club wanted to estimate the proportion of children that have a dog as a pet. If the club wanted the estimate to be within 3% of the population proportion, how many children would they need to contact? Assume a 95% level of confidence and that the club estimated that 30% of the children have a dog as a pet.
Another Example A study needs to estimate the proportion of cities that have private refuse collectors. The investigator wants the margin of error to be within .10 of the population proportion, the desired level of confidence is 90 percent, and no estimate is available for the population proportion. What is the required sample size?
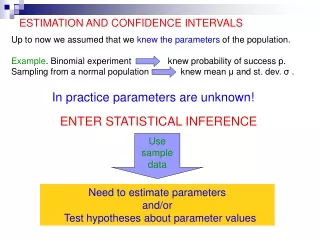
GOALS • Define a hypothesis and hypothesis testing. • Describe the five-step hypothesis-testing procedure. • Distinguish between a one-tailed and a two-tailed test of hypothesis. • Conduct a test of hypothesis about a population mean. • Conduct a test of hypothesis about a population proportion. • Define Type I and Type II errors.
What is a Hypothesis? A Hypothesis is a statement about the value of a population parameter developed for the purpose of testing. Examples of hypotheses made about a population parameter are: • The mean monthly income for systems analysts is $3,625. • Twenty percent of all customers at Bovine’s Chop House return for another meal within a month.
What is Hypothesis Testing? Hypothesis testing is a procedure, based on sample evidence and probability theory, used to determine whether the hypothesis is a reasonable statement and should not be rejected, or is unreasonable and should be rejected.
Important Things to Remember about H0 and H1 • H0: null hypothesis and H1: alternate hypothesis • H0 and H1 are mutually exclusive and collectively exhaustive • H0 is always presumed to be true • H1 has the burden of proof • A random sample (n) is used to “reject H0” • If we conclude 'do not reject H0', this does not necessarily mean that the null hypothesis is true, it only suggests that there is not sufficient evidence to reject H0; rejecting the null hypothesis then, suggests that the alternative hypothesis may be true. • Equality is always part of H0 (e.g. “=” , “≥” , “≤”). • “≠” “<” and “>” always part of H1
How to Set Up a Claim as Hypothesis • In actual practice, the status quo is set up as H0 • If the claim is “boastful” the claim is set up as H1 (we apply the Missouri rule – “show me”). Remember, H1 has the burden of proof • In problem solving, look for key words and convert them into symbols. Some key words include: “improved, better than, as effective as, different from, has changed, etc.”
Left-tail or Right-tail Test? • The direction of the test involving claims that use the words “has improved”, “is better than”, and the like will depend upon the variable being measured. • For instance, if the variable involves time for a certain medication to take effect, the words “better” “improve” or “more effective” are translated as “<” (less than, i.e. faster relief). • On the other hand, if the variable refers to a test score, then the words “better” “improve” or “more effective” are translated as “>” (greater than, i.e. higher test scores)
Type of Errors in Hypothesis Testing • Type I Error • Defined as the probability of rejecting the null hypothesis when it is actually true. • This is denoted by the Greek letter “” • Also known as the significance level of a test • Type II Error • Defined as the probability of failing to reject the null hypothesis when it is actually false. • This is denoted by the Greek letter “β”
p-Value in Hypothesis Testing • p-VALUEis the probability of observing a sample value as extreme as, or more extreme than, the value observed, given that the null hypothesis is true. • In testing a hypothesis, we can also compare the p-value tothe significance level (). • If the p-value < significance level, H0 is rejected, else H0is not rejected.
What does it mean when p-value < ? (a) .10, we have some evidence that H0 is not true. (b) .05, we have strong evidence that H0 is not true. (c) .01, we have very strong evidence that H0 is not true. (d) .001, we have extremely strong evidence that H0 is not true.
Testing for the Population Mean: Population Standard Deviation Unknown • When the population standard deviation (σ) is unknown, the sample standard deviation (s) is used in its place • The t-distribution is used as test statistic, which is computed using the formula:
Testing for the Population Mean: Population Standard Deviation Unknown - Example The McFarland Insurance Company Claims Department reports the mean cost to process a claim is $60. An industry comparison showed this amount to be larger than most other insurance companies, so the company instituted cost-cutting measures. To evaluate the effect of the cost-cutting measures, the Supervisor of the Claims Department selected a random sample of 26 claims processed last month. At the .01 significance level is it reasonable to conclude that the mean cost to process a claim is now less than $60? The sample information is reported below.
Testing for a Population Mean with an Unknown Population Standard Deviation- Example Step 1: State the null hypothesis and the alternate hypothesis. H0: ≥ $60 H1: < $60 (note: keyword in the problem “now less than”) Step 2: Select the level of significance. α = 0.01 as stated in the problem Step 3: Select the test statistic. Use t-distribution since σ is unknown
Testing for a Population Mean with an Unknown Population Standard Deviation- Example Step 4: Formulate the decision rule. Reject H0 if t < -t,n-1 Step 5: Make a decision and interpret the result. Because -1.818 does not fall in the rejection region, H0 is not rejected at the .01 significance level. We have not demonstrated that the cost-cutting measures reduced the mean cost per claim to less than $60. The difference of $3.58 ($56.42 - $60) between the sample mean and the population mean could be due to sampling error.
In class practice • One-sample t-test • Analyzecompare meansone sample t-test • Use 1991 U.S. General Social Survey.sav • Find out: Is the average age of the respondents 40 years old? • The mean of number of brothers and sisters is 4?