Download
1 / 27
270 likes | 426 Vues
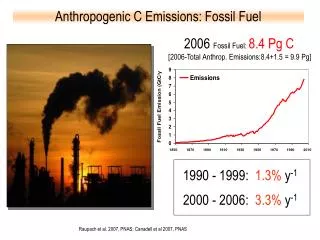
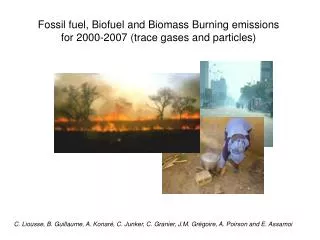
Fossil fuel, Biofuel and Biomass Burning emissions for 2000-2007 (trace gases and particles). C. Liousse, B. Guillaume, A. Konaré, C. Junker, C. Granier, J.M. Grégoire, A. Poirson and E. Assamoi. Fossil fuel and Biofuel emissions.

E N D
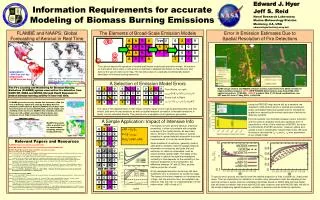
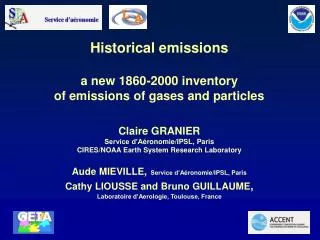
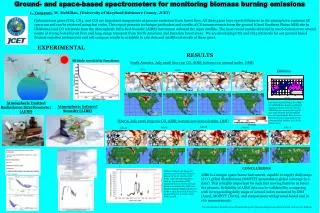
Fossil fuel, Biofuel and Biomass Burning emissions for 2000-2007 (trace gases and particles) C. Liousse, B. Guillaume, A. Konaré, C. Junker, C. Granier, J.M. Grégoire, A. Poirson and E. Assamoi
Fossil fuel and Biofuel emissions ++ For the first time to our knowledge a coherent inventory for gases and particles based on the same method and proxy data (fuel consumption, fuel usage..) - - Africa data are extracted from our global model of emissions Pollutants : CO, CO2, NOx, NMVOC, SO2, BC, OCp, OCtot African Emissions are provided country by country Spatialization is done by using the GISS population map
A bottom-up method (based on Junker and Liousse, ACPD 2006) United Nations : Energy database Fuel consumption data for 185 countries, 33 different fuels and over 50 different usage/technology categories Emissions are fuel-dependant, fuel usage-dependant and technology-dependant Our « lumping » : Industrial/Domestic/Traffic Developed/Semi developed/Developing => Emission factors for 3 country classifications, 8 different fuels and 3 usage categories Population density within each country (population map) and emissions country/country => 1°X1° spatial distribution of emissions
EF values for gases CO, NOx, SO2, NMVOC CO2
EF (BC)… EF (OCp)… EF values for Black carbon and primary organic carbon
BC (tons/1°x1°) 0 250 500 1000 2500 5000 Year 2000 Africa Fossil fuel and biofuel combustions BC 0.64 Mt(BC) CO 49.7 Mt(CO) CO (kt/1°x1°) 0 25 50 100 250 500
0 0.05 0.1 1000 1 2.5 5 100 0.25 0.5 10 (kt/1°x1°) Year 2000 Africa Biofuel and Fossil fuel combustions SO2 NMVOC NOx 10.1 Mt(SO2) 5.5 Mt(NMVOC) 5.6 Mt(NO2)
Regional differences on the predominant sources over Africa Fossil fuel BC Biofuel BC
African BF and FF emissions per regions BC NMVOC CO NOx SO2
Comparison with EDGAR 2000 • NMVOC : 8,35 Mtons/(5,5-6,7)* Mtons : (-20%)->(-34%) • CO : 72,6 Mtons/49,7 Mtons : -31,5% • Less domestic emissions • NOx : 4,9 Mtons/5,6 Mtons : + 14% • SO2 : 4,17 Mtons/10,1 Mtons : +142% => Important role of South Africa (*depending on NMVOC Emission factors)
To conclude • We have constructed a flexible and coherent inventory for gases and particles with the same proxidata and assumptions African Biofuel and fossil fuel emissions : In AMMA : EF characterization for unknown fuels (zems, trucks…) On going in our programs (POLCA and SACCLAP) : An improvement of African fuel consumption database • UNdata update from African database (in construction) ex : diesel consumption in Ivory Coast : + 200% when considering Africaclean database => phD E. Assamoi 2007-2010 • By considering the appropriate fuel consumption (zems, trucks..)
Urban emission characterization at Cotonou - May 2005, August 2006 A fixed station at the most polluted place (Aerosol size, chemical composition, optical properties, CO/CO2…. ) Measurements of emission factors (« zem », trucks…) First example : CO/CO2 = 0.42 EF(Black carbon) = 0.79g/kgdm
Urban emission characterization at Cotonou - May 2005 A mobile experiment : transects in Cotonou with a taxi equipped by different samplers) : high level of concentrations
Biomass burning emissions (savanna, forest and agricultural fires) The most adapted method to derive african BB emissions: • a bottom up method based on satellite burnt area map (see BBSO workshop, Dec. 2005)) Pollutants : BC, OCp, OCtot, CO, CO2, NOx, NMVOC, SO2 and all the species listed in Andreae and Merlet, 2004 Emissions = SB x GLCv x BEv x BDv x EFv SB : area burned => GBA 2000 product (0.5°x0.5°, monthly) => L3JRC 2000-2007 products (1kmx1km, daily) GLCv : quantity of vegetation v present in cell (%) => GLC 2000 map (0.5°x0.5°) BEv,BDv : biomass density and burning efficiency by vegetation type EFv : emission factor by vegetation type => An important work based on Liousse et al., 2005, Michel et al., 2006 with inputs of P. Mayaux (Ispra) considering the GLC vegetation types
Intercomparison with our other African Biomass burning BC emissions Hao statistical data Mouillot Burnt areas AVHRR Burnt areas ATSR-GBA products SPOT GBA Burnt areas
GLC map (Ispra) ( 0.5°x0.5°) Our assumptions…
Burned areas (km2/0.5°x0.5°) 0 250 500 1000 2500 5000 January 2000 July 2000 August 2000 92000 km2 73000 km2 51000 km2 December 2000 125000 km2
Burned Areas Burned Biomass 723 Mt(dry matter) 125000 km2 CO BC 448 kt(BC) 51 Mt(CO) December 2000
BC (tons/0.5°x0.5°) 5000 0 07/2000 08/2000 01/2000 BC emissions in TgC in 2000 12/2000 448 kt(BC) • Suitable comparison between UMD/GLC • High difference if comparing with the old inventory
Comparison with EDGAR 2000 • CO : 222,5 Mtons/285 Mtons : +28% • NOx : 11 Mtons/18 Mtons : + 64% • SO2 : 2,03 Mtons/1,9 Mtons : -6,4%
BC (tons/1°x1°) 0 250 500 1000 2500 5000 10000 25000 African BC emissions by source types Biomass burning These inventories have been tested In ORISAM-TM4 and RegCM3 models 2.28 Mt(BC) Biofuel combustions Fossil fuel combustions 0.20 Mt(BC) 0.44 Mt(BC)
What is available? All these inventories available for the AMMA people. => Fossil fuel and biofuel : 1°x1°, yearly, 2000-2003 => Biomass Burning : 2000 : 0.5°x0.5°, monthly => now 2000-2007 : 1kmx1km, daily => in autumn 2007 (upon request with your needed spatial and temporal scales)
CAPEDB : Fossil fuel and biofuel sources
GBBE : Biomass burning sources
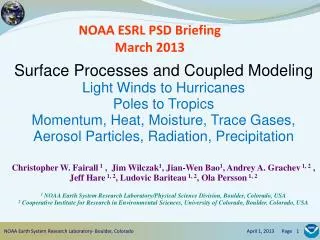
Impact of NO emissions from soils on ozone formation under tropical conditions. C. Delon*, D. Serça, J.P. Chaboureau, R. Dupont, C.Mari Model: MesoNH Chemistry. Res: 20km/20km, 100/100 points. 52 vertical levels (surface to 28km). From 05/08 00h to 07/08 2006 00h. ECMWF every 6h dynamic forcing. Vertical profiles of clean atmosphere for chemical initialisation. RACM chemical scheme. Parameterized convection (Bechtold et al., 2001) and NOx from lightning (Mari et al., 2006). NO source from soil from a Neural Network parameterization (Delon et al., 2007). SOIL NOX EMISSIONS in the ANN parameterization are linked to surface temperature and WFPS, deep soil temperature (20-30cm), fertilization rate, soil pH, sand percentage, and wind speed. pH and soil moisture are the most determinant parameters.
Impact on ozone and NOx concentrations NOx CONCENTRATIONS from 0 to 2000m without (left) and with (right) NO emissions from soils. Concentrations reach 300 ppt at noon when NO are emitted by the soil (<20ppt if no emissions). Measured NOx concentrations range from 100 to 500 ppt at 500m height. OZONE FORMATION in the lower troposphere (0-2000m) is enhanced by NO emissions from soils (+10 ppb). Measured O3 concentrations reach 43 ppb. NOx concentrations (ppt) 2006/08/06 noon. Vertical cross section along the BAE-227 flight path (NE of Niamey). The introduction of an on line soil NO emissions calculation in MesoNHC is an important step to improve chemistry description in the lower troposphere. The relation between NO flux and physical and meteorological parameters ensures an immediate impact of NO emissions on ozone levels (not possible with monthly inventories). O3 concentrations (ppb) 2006/08/06 noon.
What is available? • Soil NO flux parameterisation: with j=17 where x1 to x7 correspond to surface WFPS, surface soil temperature, deep soil temperature, fertilisation rate, sand percentage, pH and wind speed respectively Easily pluggable in regional chemistry transport models. . Available soon: NO flux inventory for the rainy season in West Africa (4-21°N, -5-13°E). Other seasons (dry and transition) will come in 2008.