Download
1 / 1
10 likes | 158 Vues
Ground- and space-based spectrometers for monitoring biomass burning emissions. L. Yurganov , W. McMillan, (University of Maryland Baltimore County, JCET).

E N D
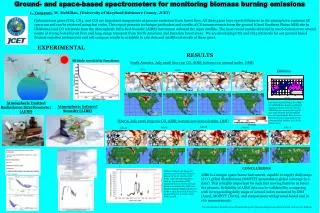
Ground- and space-based spectrometers for monitoring biomass burning emissions L. Yurganov, W. McMillan, (University of Maryland Baltimore County, JCET) Carbonaceous gases (CO2, CH4, and CO) are important components of gaseous emissions from forest fires. All these gases have spectral features in the atmospheric emission IR spectrum and can be retrieved using fast codes. This report presents technique particulars and results of CO measurements from the ground (Great Southern Plains ARM site in Oklahoma) and CO retrievals from the Atmospheric Infra Red Sounder (AIRS) instrument onboard the Aqua satellite. The most recent results obtained in 2006 demonstrate several events of strong boreal forest fires and long-range transport from North American and Eurasian forest areas. We are developing CO2 and CH4 retrievals for our ground-based thermal emission instruments and will compare results to available in situ data and satellite retrievals of these gases. EXPERIMENTAL RESULTS Altitude sensitivity functions North America, July 2006 (top row CO, AIRS; bottom row aerosol index, OMI) July 5 July 6 July 7 Validation July 8 Atmospheric Emitted Radiatiance Interferometer (AERI) Two data sets recorded at the ARM site in Oklahoma during a period of passing polluted air from Canada. AERI data are in pink (during 179th – 191st days of 2006 the instrument was not operational). Blue dots are CO mixing ratios measured by the Lawrence Natl. Berkley Lab. In the surface layer. Atmospheric Infrared Sounder (AIRS) Siberia, July 2006 (top row CO, AIRS; bottom row aerosol index, OMI) CO scale July 28 July 27 July 29 July 30 July 26 The spectral measurement range of the instrument: 3300 to 520 wavenumbers (cm-1) or 3-19.2 microns Spectral resolution: 1.0 cm-1. Instrument field-of-view 1.3 degrees. A calibrated sky radiance spectrum is produced every 8 minutes. CONCLUSIONS AIRS is a unique space borne instrument, capable to supply daily maps of CO global distributions (MOPITT accumulates global coverage in 4 days). This is highly important for such fast moving features as forest fire plumes. Reliability of AIRS data can be validated by comparing with corresponding daily maps of aerosol index measured by OMI (Aura), MOPITT (Terra), and comparisons with ground-based and in situ measurements. We acknowledge a financial support from NOAA grant # NA04A0AR4310095 and from NASA Carbon Cycle Program CO total column amounts (red squares) measured near Moscow, Russia, by Dr. E. Grechko (IAP RAS). 210th day corresponds to July 30, when enhanced CO, transported from Siberia through Arctic was detected by AIRS over Western Russia. Enhanced aerosol in the surface layer (black line) was measured by Dr. A. Isakov (IAP RAS) as well.