Download
1 / 16
170 likes | 222 Vues
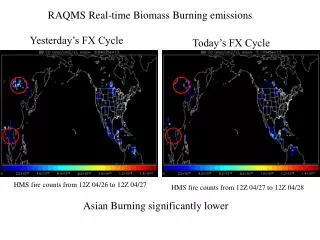
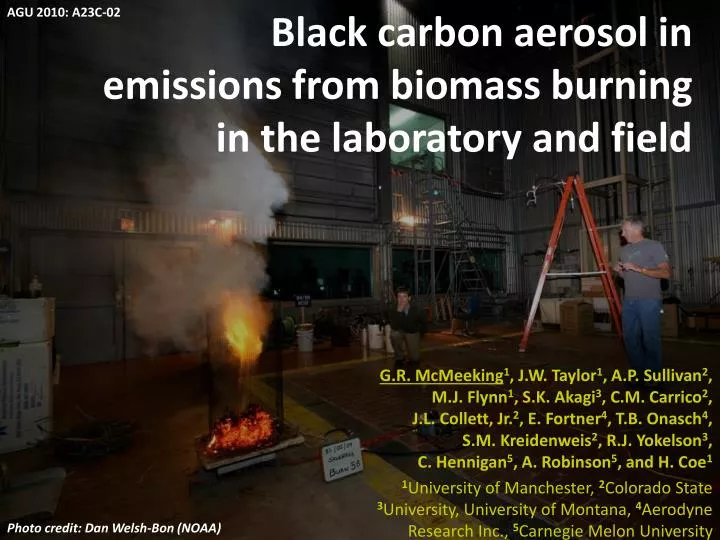
AGU 2010: A23C-02. Black carbon aerosol in emissions from biomass burning in the laboratory and field.

E N D
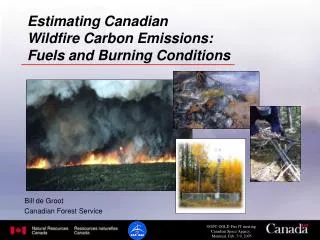
AGU 2010: A23C-02 Black carbon aerosol in emissions from biomass burning in the laboratory and field G.R. McMeeking1, J.W. Taylor1, A.P. Sullivan2, M.J. Flynn1, S.K. Akagi3, C.M. Carrico2, J.L. Collett, Jr.2, E. Fortner4, T.B. Onasch4, S.M. Kreidenweis2, R.J. Yokelson3, C. Hennigan5, A. Robinson5, and H. Coe1 1University of Manchester, 2Colorado State 3University, University of Montana, 4Aerodyne Research Inc., 5Carnegie Melon University Photo credit: Dan Welsh-Bon (NOAA)
Laboratory FLAME-3 US Forest Service Fire Science Lab Missoula, Montana September 2009 Dan Welsh-Bon (NOAA) Aircraft San Luis Obispo Biomass Burning Experiment USFS Twin Otter Central California, USA November 2009 Bob Yokelson (U. of Montana)
Why even more biomass burning BC measurements? Single particle soot photometer (SP2) BC size distributions from Schwarz et al., 2006 No filter artifacts BC mixing state
Results from a “typical” laboratory experiment FIRE DURATION
Emission factors as a function of… …fuel type mass species emitted Emission factor = mass fuel consumed or combustion conditions? BC emission factor by type: Desert shrubs = 1.5-2 g kg-1 dry fuel Southeastern grasses = 0.6-1 Pine needles = 0-0.5
Optical properties From: Lack and Cappa, AS&T, 2010 Sun et al. (2007) 532 nm = 0.31 m2/g “Non-BC absorption” / [OC mass]: 780 nm = 0.10 m2/g
Changes in BC mixing state Photo: Dan Welsh-Bon (CU/NOAA)
Conclusions • Consistent [BC EF vs MCE] for aircraft and laboratory • BC EF range between 0-2 g/kg dry fuel • Optical properties depend on BC/TC ratio: abs. eff. and wavelength dependence decreases for higher BC mass fractions • BC mass absorption efficiency: 3.6 m2/g at λ = 780 nm, 7.9 m2/g at λ = 532 nm • OC mass absorption efficiency: 0.1 m2/g at λ = 780 nm, 0.3 m2/g at λ = 532 nm • BC becomes rapidly mixed/coated with other material for aircraft and smog chamber
Thanks! FLAME 3 project partners (not all pictured) SLOBBErs Supported by: Strategic Environmental Research and Development Program (SERDP) UK Royal Society Travel Grant
BC emission factors mass species emitted Emission factor = mass fuel consumed “Desert” shrubs Mass of fuel consumed estimated from: CO2, CO, fuel carbon content, and mass consumed pine needles & “duffs”
Early results from CMU chamber Proxies for coating thickness on BC increase with time following lights on!