Download
1 / 23
230 likes | 316 Vues
Investigating genetic structure in North Pacific seals for evolutionary and management purposes. Challenges, sampling methods, and results for harbor, spotted, bearded, ringed, and ribbon seals presented.

E N D
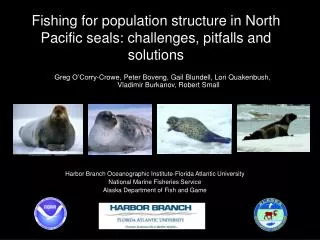
Fishing for population structure in North Pacific seals: challenges, pitfalls and solutions Greg O’Corry-Crowe, Peter Boveng, Gail Blundell, Lori Quakenbush, Vladimir Burkanov, Robert Small Harbor Branch Oceanographic Institute-Florida Atlantic University National Marine Fisheries Service Alaska Department of Fish and Game
The resolution of population structure in North Pacific seals is crucial for investigating evolutionary processes (local adaptation, gene flow) and is central to effective management (biodiversity, stock identity) • The analysis of population genetic structure traditionally consists of: • Testing explicit hypotheses, such as genetic differentiation between breeding groups • B) Inference about what genetic heterogeneity means in terms of historical relationships or the level of contemporary gene flow and dispersal among groups This proven difficult in several North Pacific seal species • Continuously distributed, often with multiple breeding sites • Highly mobile – make long-distance seasonal movements • Long-lived – many opportunities for effective or actual dispersal • Roles of site fidelity v.s. philopatry unclear • Large historical population sizes – high genetic diversity, low rates of drift
Under such conditions, sampling at the appropriate location, season and spatial scale is central to resolving population genetic structure and ultimately dispersal and breeding patterns Large sample numbers from breeding sites, ideally pups, over multiple years To date sampling has been predominantly: A. opportunistic, inc. harvest B. tied to field studies that often occur outside the breeding season, C. focused on sub-adult and adult seals Determining the population of origin of such samples is central to management objectives but their utility in characterizing baseline populations is limited
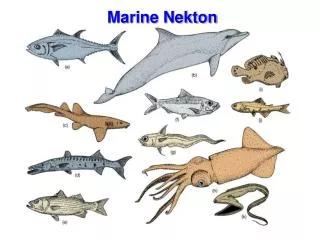
Species: harbor seal Spotted seal Bearded seal Ringed seal Ribbon seal V. Burkanov K.J. Frost
Genetic markers mtDNA (430bp) Microsatellites (n=10 -18) Statistical Hypothesis testing – a priori stratification χ2, Fst, Фst, Rst Phylogeography –a priori stratification phylogenetic reconstruction, e.g. MSN Landscape Genetics – no a priori stratification Model-based cluster analysis (Structure) Individual-based spatial analysis kin-based analysis –no a priori stratification the spatial distribution of close kin Big picture at range-wide scale v.s detailed picture at local scales
Spotted seal, Phoca largha Po Hai Sea to Beaufort Sea large population sizes N ~ 300,000 pack ice breeders – triads breeding concentrations have been identified extensive movements Population structure across species range Stock structure Interbreeding with harbor seals Sampling regime: opportunistic systematic (satellite tagging) hunting (seasonal) mtDNA (419bp) n=249 Microsats (18 loci) n=207
Spotted Seal – Phoca largha 50 13 60 15 30 21 5 29 K. Frost Sample numbers: 249
Spotted seal, Phoca largha Mitochondrial DNA High mtDNA diversity , 172 haplotypes/249 samples large historical population sizes Subdivision among the: Bering/Chukchi/Beaufort Seas Okhotsk Sea Sea of Japan Po Hai Sea No subdivision observed within the Bering/Chukchi/Beaufort Sea suggests extensive movement and dispersal supported by satellite telemetry
Spotted seal, Phoca largha microsatellites Structure, K=2 the most likely, corresponds to: (1) B-C-B and Okhotsk (2) Sea of Japan and Po-Hai sea However, sample size is small and sampling regime was not ideal
Harbor seal, Phoca vitulina Large population sizes, N >180,000 Continuously distributed in shelf waters Hundreds of terrestrial and glacial ice breeding sites Majority of movements <50km, but also extensive movements (>500km) Uneven population density across range Differing trends across range V. Burkanov
Johns Hopkins Inlet (JHI) Glacier Bay National Park Courtesy: Jaimie Womble
Harbor seal, Phoca vitulina Large population sizes Continuously distributed in shelf waters Hundreds of breeding sites Extensive movements Initial stratification challenging Sample size: n=1,388 Sampling sites , n=128 Sampling was uneven, occurred across all seasons and involved primarily sub-adults and adults
Mitochondrial DNA High haplotypic diversity 342 unique haplotypes weak phylogeographic partitioning general isolation-by-distance pattern clear macro-geographic structure among major centers of abundance Westlake and O’Corry-Crowe, 2002
Harbor seal population genetic structure – Statistical power Statistical power: Low: 13 areas Moderate: 6 areas High: 12 O’Corry-Crowe et al., 2003
Harbor seal population genetic structure – mtDNA findings mtDNA differentiation on the scale of 150-540km Limited female dispersal Current stocks are too broadly defined ? ? ? O’Corry-Crowe et al., 2003
Harbor seal population genetic structure – microsatelites (10 loci) Statistical power: Low: 8 areas High: 10 O’Corry-Crowe et al., 2003
Harbor seal population genetic structure – microsatellites (10 loci) Microsatellite differentiation on scale of 300-700km appears to be less nDNA differentiation than mtDNA Greater male mediated gene flow O’Corry-Crowe et al., 2003
Harbor seal population genetic structure: Landscape genetics Landscape Genetics approach: no assumptions are made about population boundaries beforehand. model-based clustering (Structure): K=1 is the most likely No evidence of > 1 distinct nuclear gene pool No deep genetic breaks indicative of long-term isolation of gene pools
Harbor seal population genetic structure - kin distance ∑ (Py – P*) ∑ (Px – P*) Individual-based analysis kinship, relatedness, genetic mark-recapture GIS R = Queller & Goodnight (1989) 0.7 Kin distance 0.2 0.05 0.1 Dispersal distance Genetic discontinuities Contemporary structure 0.0
Harbor seal population genetic structure – Kin distance 452,929 pair-wise R estimates Most comparisons had R<0.2 Highest R>0.7, potential 1st or 2nd order relatives >80% did not share mtDNA lineage pairs were sampled up to 9 years apart kin distance can exceed 500km multiple links were found among some locations Findings still preliminary
Conclusions • Historical population sizes were large in most seal species, generating high levels of neutral genetic variation and resulting in slow rates of genetic divergence, such that genetic differences are small and difficult to detect • Sampling regimes to date have not been optimal. Concerted efforts must be made to design sampling protocols to the question being addressed: characterize population structure in North Pacific seal species. Specifically, sample large numbers of seals, preferably pups, on breeding grounds over multiple years • All the analyses are data hungry, requiring substantial sample sizes from multiple groups/areas • Recent common ancestry, asymmetric dispersal and changing population dynamics indicate that equilibrium-based methods may not be appropriate • New markers need to be investigated, including markers under selection which may require fewer samples to detect biologically relevant population subdivision
Funding for this research was provided by NOAA-NMFS, and ADF&G Much of the earlier work was conducted by Robin Westlake-Storey Thanks are due to all those, many anonymous, who went to the trouble of collecting and sending us samples, including: M. Cameron, A. Trukhin, J. Cesarone, B. Robson, L. Dzinich, K. Frost, G. Jarrell, L. Jemison, G. Sheffield, M. Kookesh, J. Lewis, L. Lowry, R. Suydam, B. Mahoney, E. Mathews, R. Pavlik, K. Raum-Suryan, M. Riedel, D. Savareese, R. Small, U. Swain, M. Turek , V. Vanek, D. Withrow, and K. Wynne, Invaluable lab assistance was provided by: R. Westlake-Storey, K. Raschen, L. Hansen, C. Reed, A. S. Costa, C. Lux, Aviva Rosenberg, Monica DeAngelis, Marc Basterretche, Carolina Bonin, Amy Frey and Vicki Pease For helpful advice and additional support, thanks to: K. Brix, L. Lowry, K.Frost, J. Bengtson, M. Payne, A. Jensen, R. LeDuc, J Burns, M. Adkison, B. Kelly and D. DeMaster Alaska Ice-Seal Committee
Define population strata to test difficult in continuously distributed species difficult if samples are not from semi-discrete breeding areas Defining strata in continuously distributed species tends to be subjective, especially if you have no control over sample collection Many breeding groups may not be identified or sampled