Download
1 / 66
660 likes | 843 Vues
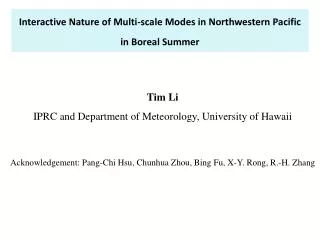
Interactive Nature of Multi-scale Modes in Northwestern Pacific in Boreal Summer. Tim Li IPRC and Department of Meteorology , University of Hawaii Acknowledgement: Pang-Chi Hsu, Chunhua Zhou, Bing Fu, X-Y. Rong, R.-H. Zhang. Multi-scale modes in the western North Pacific (WNP).

E N D
Interactive Nature of Multi-scale Modes in Northwestern Pacific in Boreal Summer Tim Li IPRC and Department of Meteorology, University of Hawaii Acknowledgement: Pang-Chi Hsu, Chunhua Zhou, Bing Fu, X-Y. Rong, R.-H. Zhang
Multi-scale modes in the western North Pacific (WNP) 90 days or longer 10-90 days LFBS (a.c., interannual) Intraseasonal oscillation (ISO) Large-scale control < 10 days Upscale feedback Synoptic-scale variability (SSV) What are dominant inter-annual, intra-seasonal and synoptic-scale modes in WNP? How to reveal and understand both the large-scale control and upscale feedback!
Leading Inter-annual mode in Asia-W. Pacific 850 hPa winds and local SST anomalies(1957–2001) • Biennial tendency associated with ENSO turnabout • Distinct evolutions of anticyclonic anomalies over SIO and WNP Wang, Wu, Li, 2003, J. Climate
A positive thermodynamic air-sea feedback mechanism Wang et al. 2000 El Nino heating atmospheric Rossby wave response cold SSTA in WNP anomalous AC EAM
A Positive Thermodynamic Air-Sea Feedback in the Southeast Indian Ocean in Northern Summer (Li et al. 2003, J. Atmos. Sci.) Warm EQ Sumatra Cold Anticyclonic Circulation Mean SE wind A primary mechanism for the phase locking of IOD
ISO and SSV in boreal summer over the WNP • Key features in WNP: • Maximum ISO variance, northwestward propagation • Dominant SSV mode: A NW-SE oriented synoptic wave train (Lau and Lau 1990) • Strong annual cycle and interannual variability of the monsoon rainfall • Well separated low-frequency background state (LFBS, including annual and interannual variations), ISO and SSV spectrum peaks ISO SSV
ISO structure and propagation in WNP Hsu and Weng 2001 850-hPa Vorticity (contour) - OLR )shading) phase structure 10-m divergence (contour) - OLR (shading) phase structure
Why does the vorticity located to the north of ISO convection? Vorticity (shaded) Jiang, Li, and Wang 2004, J. Climate Barotropic vorticity is generated to the north of ISO convection due to the interaction of the background easterly shear with ISO baroclinic motion.
OLR phase relation with SST, q, LHF, and SWR surface temperature (green), specific humidity (925hPa) (purple) latent heat flux (green), shortwave radiation flux (purple)
Dominant Synoptic-Scale Mode in the WNP: A northwest-southeast oriented synoptic wave train Lau and Lau (1990) : An alternative positive and negative vorticity wave train with timescale: 2-8 days, wavelength: 2500 km, propagation: northwestward. Questions: What is the origin of the synoptic wave train? What determines its zonal wave- length and phase propagation? (
SWT: A major type of precursor synoptic perturbation for TC genesis in WNP 1-day sequences of 3-8-day filtered surface wind pattern associated with SWT. Red dot indicates Typhoon “Man-yi” genesis location. Red circle: Anti-cyclonic flow Green circle: Cyclonic flow • Typhoon Manyi genesis location/time Fu, Li, et al. 2007, Wea. Forecasting
For 34 TCs (>=tropical storm) in 2000 and 2001, 70% cases are associated with low-level precursor signals. Other 30% are related to middle-level or upper-level processes. A. Pacific Easterly Waves (PEW) (7 cases) 20% B. Tropical Cyclone Energy Dispersion (TCED) (6 cases) 20% C. Synoptic Wave Train (SWT) (11 cases) 30% D. Others (mid-level or upper influence) (10 cases) Fu, Li, et al. 2007, Wea. Forecasting
Hypothesis: The synoptic-scale wave train in WNP results from instability of the summer mean flow in the presence of the convection-circulation-moisture feedback. Strategy:conduct numerical experiments with an anomaly AGCM that specifies 3D summer mean flow; introduce a small perturbation initially and examine how the perturbation evolves with time. Unstable mode with convective feedback Li 2006, J. Atmos. Sci. Least damped mode without convective feedback
Sensitivity of solutions to initial perturbations (a) Small-wavelength random perturbation Regardless of initial perturbation type, the final solution is always a northwest-southeast oriented wave train that has a wavelength of about 2500km, propagating northwestward. Numerical experiments demonstrate that SWT is an unstable mode of the summer mean flow in WNP in the presence of convection-circulation-moisture feedback. (b) Equatorial MRG waves
Major ISO activity centers are located in WNP and BoB. ISO northward propagation induces strong intraseasonal rainfall variability over monsoon land regions. Question: What causes the year-to-year change of ISO variability? Previous studies: simultaneous correlation with EP SSTA is not statistically significant !
Left: El Nino SSTA evolution Bottom: BSISO intensity difference (El Nino minus La Nina) Interannual variation of ISO variance is ENSO phase dependent! Lin and Li 2008 J Climate Developing phase Shading: 95% confidence level Decaying phase
Locations of TS formation and SST anomalies in Jul – Sep (Wang and Chan 2002, J. Climate) (a) Warm (b) Cold
Climate control of WNP TC genesis: ENSO control Table 1 Correlation coefficients between WNP TC number in JJAS and Nino3.4 index for 1970-2010. Red numbers indicate correlation coefficients significant at 95% level. Shading: 850hPa relative vorticity anomaly, Vector: 850hPa wind anomaly Li 2012
EP El Nino developing summer (JASO) 2.0 Composites of Tropical Cyclone (TC) genesis density (year-1) Chung and Li 2013 5.5 Total: 15.5 CP El Nino developing summer (JASO) 6.4 3.8 Total: 17.0 La Nina developing summer (JASO) 8.3 0.7 Total: 14.7
Observed MJO-TC relationship (Liebmann 1994) A two-way interactive nature? On one hand, MJO modulates SSV; on the other hand, SSV feeds back to intraseasonal variability.
Synoptic 850hPa wind (vector) and vorticity (contour) during ISO wet(left) and dry (right) phase (Zhou and Li 2010, JC) Day -2 Day 0 Day 2 Day 2
A mechanism for the enhanced synoptic disturbances during ISO wet phase: vertical shear effect An easterly shear leads to the amplification of Rossby waves at lower levels, whereas a westerly shear favors the amplification of Rossby waves at upper levels. Wang and Xie 1996, JAS
The vertical shear effect (Cont.) Right: Evolution of maximum perturbation kinetic energy under a constant easterly shear (solid line), westerly shear (dashed line.JJA SST and surface moisture fields are specified. Left: Anomaly AGCM simulation with specified 3D summer (JJA) mean flows and SST and surface moisture condition Li 2006, JAS
Easterly (westerly) shear favors the amplification of TCED-induced Rossby wave train in lower (upper) troposphere Ge, Li, et al. 2007, GRL (a) CTRL (b) ESH (c) WSH Upper-level Middle-level lower-level
Synoptic Q1 and Q2 patterns during ISO wet and dry phases Wet phase Dry phase Synoptic Q1 and Q2 are in phase with eddy vorticity disturbances Enhanced synoptic Q1 and Q2 during the ISO wet phase
Question: How does SSV feed back to ISO? Hypothesis 1: through the nonlinear rectification of the surface latent heat flux u’, v’ synoptic motion larger Pre-conditioning/moistening ISO westerly phase (enhanced convective phase) + feedback to ISO smaller ISO easterly phase (suppressed convective phase)
Measure the synoptic contribution to intra-seasonal (10-90d) latent heat flux (LHF) • Strategy: • 1. Calculate the surface latent heat fluxes based on the bulk formula with • mean ( ¯ ) + synoptic (3-10d, ’ ) • mean ( ¯ ) + synoptic (3-10d, ’ ) + intraseasonal (10-90d, ˜ ) • 2. Project the LHF into the ISO (10-90d) component Nonlinearly rectified LHF contributes to 30-50% of total intraseasonal LHF! STD (10-90d LHF, based on 3-10d + mean u,v,dq) STD (10-90d LHF, based on total u,v,dq)
Phase relation between nonlinear rectified LHF andISO convection/moisture Shading: rectified LHF Contour: OLR Shading: 925hPa moisture Contour: OLR Western Pacific ISO wet phase ISO dry phase Zhou and Li 2010
Hypothesis 2: SSV feeds back to ISO through the nonlinear rectification of atmospheric apparent heat sources. Total intraseasonal apparent heating field 400-500 hPa 2-2.5 K/day 1) All the variables (e.g., u, v, ω, T, q) are partitioned into 2) Calculate the Q1 (Q2) fields based on the total components 3) The so-calculated Q1 (Q2) fields are then subjected to a 10-90-day band-pass filter
Nonlinearly rectified intraseasonal Q1 • Method: • Calculate Q1 (Q2) based on the sum of LFBS and SSV without involving ISO motion • So-calculated Q1 (Q2) are subjected to a 10-90-day band-pass filter operator Intraseasonal apparent heating field contributed by the eddy-mean flow interaction 12%~30%
Phase relation between the nonlinearly rectified Q1 and ISO convection Shading: 10-90d filtered OLR field Contour: nonlinearly rectified 10-90d Q1 Nonlinearly rectified intraseasonal heating Q1is located to the northwest of the ISO convection. SSV-mean flow interaction may contribute to the northwestward propagation of the ISO convection in WNP.
Physically how does the synoptic eddy affect ISO diabatic heating? Synoptic wave train during ISO wet phase Contour: Synoptic-scale vorticity at 850 hPa Vector: Synoptic-scale wind at 850 hPa Heating ~ < q’ * C’ > q’ and C’ denote synoptic-scale specific humidity and convergence in PBL < > denotes domain average during ISO wet or dry phase
Hypothesis 3: SSV feeds back to ISO through eddy momentum transport ISO zonal wind tendency equation: eddy momentum flux convergence ISO motion related processes (adv, pgf, fv) • While the largest terms are the pressure gradient force and the Coriolis force, they are largely offset with each other. • Both Term A and B account for the westerly tendency. About 40%of the total tendency is attributed to Term A.
3-D eddy momentum transports G R Y B westerly easterly Easterly tendency Westerly tendency westerly easterly Horizontal eddy momentum transports primarily contribute to the northward propagation of the ISO zonal wind.
A new EKE diagnosismethod 1) A dependent variable may be separated into three components Low-frequency background state (LFBS, >90days) 10-90-day ISO 3-10-day synoptic-scale disturbance 2) By multiplying u′ and v′ in the both sides of the synoptic-scale momentum equations, one may derive the perturbation EKE equation. K′=(u'2+v'2)/2
3) Apply a 10-day low-pass filtering operator (denoted by a single overbar) to the perturbation EKE equation, we have barotropic energy conversion from the LFBS and ISO flows to the synoptic-scale eddy baroclinic energy conversion from EAPE to EKE advections of EKE by both the LFBS (AMm) and the ISO (AMi) flows advection of EKEby the synoptic-scale eddy convergence of eddy geopotential flux CK and AM terms explicitly reflect the eddy-mean flow interactions. CA, AE, FG terms reflect the eddy-eddy interactions.
Strategy to isolate the ISO-SSV interaction The left hand side consists of the sum of the EKE tendencies on both the LFBS and ISO timescales (a) 1) Applying a 90-day low-pass filter, one may derive LFBS EKE tendency eq. : (b) 2) Subtracting the LFBS EKE tendency from Eq.(a), one may derive the time change rate of EKE on the intraseasonal timescale:
Energy conversion between eddy and LFBS (left) and between eddy and ISO(right) ISO to Eddy between LFBS and eddy always contributes positively to the EKE growth phase-dependent Eddy to ISO Indicating a two-way energy conversion between the ISO and synoptic-scale disturbances
MJO control on WNP TC genesis (cont.) TC genesis location (circle) and calculated barotropic energy conversion, CK (shading) (Hsu and Li 2011, J. Climate) C Both divergent and rotational parts of the ISO flow contribute to enhanced CK during its active phase
MJO impact on TC genesis and track Top: TC genesis in WNP during the YOTC (2008-2009) period OLR (red) and zonal wind (black) anomalies associated with MJO (Xu Y.-M.) Horizontal axis: Time (from 6/1 - 9/30) Bottom: Typhoon Megi (2010) sudden northward turning (Bi M.-Y.)
Routes through which SSV exerts an upscale feedback to ISO: . Nonlinear surface heat flux processes preconditioning of PBL moisture, which further triggers convection (Zhou and Li 2010) . Modulation of ISO heating through nonlinear moisture-convergence feedback (Hsu and Li 2011) . Nonlinear eddy momentum transport (Hsu and Li 2011) . Ocean reddening SSV may induce intraseasonal SST changes
Hypothesis: SSV may impact ISO through induced intraseasonal SST variation (nonlinear oceanic process) Below: power spectrum of the SST simulated by a 2.5-layer ocean model (Wang, Li, Chang 1995) with observed ERA40 surface wind and flux forcing (1985-1999) Solid line: forced by total ERA40 wind and flux fields (SSV+ISO+climatology) Dashed line: forced by ERA40 climatology plus SSV fields Conclusion: 15-25% of the intraseasonal SST variance in the tropical Indian Ocean is attributed to the nonlinear rectification of the synoptic-scale variability.
Interaction between MJO/SSV and ENSO Rong et al. (2011, QJRMS) • Background • SST • Circulation Atmospheric Noise 10-90 days MJO Large-scale control 2-7 years ENSO Transient feedback Background WWB Synoptic Eddies Upscale feedback 2-10 days • Surface wind stress • Ocean nonlinearity • Atmospheric eddy momentum transport Multi-scale interactions in the tropics HF: period less than 90 days (MJO and SSV) LF: ENSO timescale (2-7 years)
ENSO-phase dependent HF wind variability (Rong et al. 2010, QJRMS) • Time series of HF zonal wind (green line) at 170˚E, 0˚N and the LF (red line) and the climatological mean (blue solid) zonal wind anomaly over 160˚E-180˚, 5˚S-5˚N. • Variance of the HF zonal wind over 5˚S-5˚N in JJASON composed for El Niño (red bars), La Niña (blue bars) and normal (green bars) years.
How does the phase-dependent HF variability feed back to ENSO? 1: Enhance the amplitude of interannual wind stress anomaly 2: Modify the skewness of the wind stress anomaly τLF (pure effect of LF wind): τHF (include effect of HF wind): CLIM El Nino La Nina • Time series of zonal wind stress anomalies (Units: dyne/cm2) averaged over 160˚E-180˚, 5˚S-5˚N. Red and blue lines denote τHF and τLF respectively, and green shaded denotes the difference. • Skewness of τHF (red bars) and τLF(blue bars) averaged over 5˚S-5˚N.
OGCM simulations • Time evolution of SSTA along the equator: • GISST observation • OGCM simulation with C+LF wind forcing • OGCM simulation with C+LF+HF wind forcing • Difference between (c) and (b)
Conclusions WNP exhibits pronounced interannual, intraseasonal and synoptic-scale variability. There are active interactions among these scales. The synoptic wave train in WNP is well-organizedand strengthened (loosely organized and weakened) during the ISO wet (dry) phase. SSV exerts a significant contribution to ISO through the nonlinear rectification of surface LHF, apparent heating (Q1 and Q2), and eddy momentum transport. The interannual variation of ISO in WNP is ENSO-phase dependent. The impact of El Nino on TC frequency in WNP is also phase dependent. The TC number increases (decreases) during the El Nino developing (decaying) phase. There is a two-way interaction between high-frequency (intraseasonal and synoptic) wind and ENSO. On one hand, El Nino exerts a large-scale control on the strength of the high-frequency wind activity. On the other hand, high-frequency wind modulates the amplitude and skewness of El Nino.
Thanks Diamond Head
Relationship between the barotropic energy conversion and TC intensification rate TC growth rate TC decay rate In general, more (less) rapidly intensified TCs are observed during the ISO wet (dry) phase when CK is greater (smaller).
Synoptic-scale SST-vorticity phase relationship during ISO wet phase