Download
1 / 47
470 likes | 699 Vues
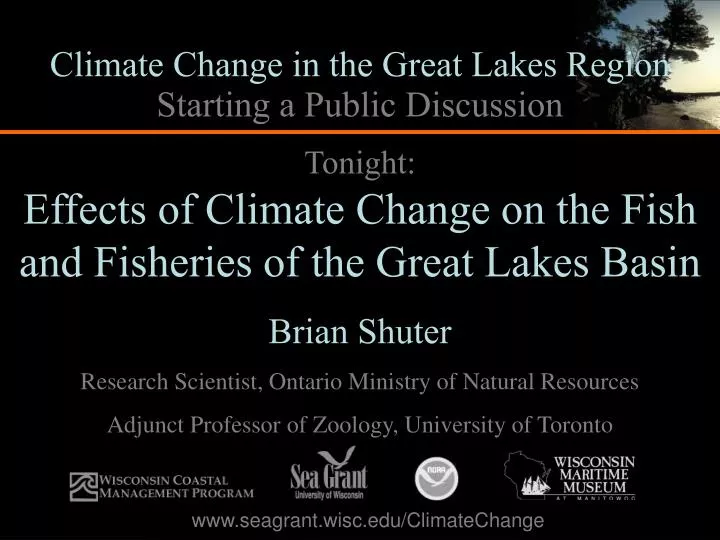
Climate Change in the Great Lakes Region. Starting a Public Discussion. Tonight: Effects of Climate Change on the Fish and Fisheries of the Great Lakes Basin Brian Shuter Research Scientist, Ontario Ministry of Natural Resources Adjunct Professor of Zoology, University of Toronto.

E N D
Climate Change in the Great Lakes Region Starting a Public Discussion Tonight:Effects of Climate Change on the Fish and Fisheries of the Great Lakes Basin Brian Shuter Research Scientist, Ontario Ministry of Natural Resources Adjunct Professor of Zoology, University of Toronto www.seagrant.wisc.edu/ClimateChange
OVERVIEW PART 1 - PAST AND FUTURE CHANGES IN CLIMATE PART 2 – IMPACTS ON LAKE ENVIRONMENTS PART 3 – IMPACTS ON FISH AND FISHERIES
PART ONE PAST AND FUTURE CHANGES IN CLIMATE
Past and Present CO2 Levels in the Atmosphere Compare to climate Over this time frame (Source: IPCC, 2001. Climate Change 2001: Synthesis Report - Figure SPM-10a on Page 33)
Global Annual Air Temp Index 1856-2000 (global annual air temp, measured as deviations from the 1856-2000 mean) 0 1856-2000 mean
Recent (1960- present) Trends Match ……… Carbon Dioxide Global Air Temp 0.0 1960 1970 1980 1990 YEAR
Natural forcings alone do not explain observed warming in 2nd half of century…simulations including JUST natural forcings cannot predict recent warming trends. Add recent trends in greenhouse gas and Sulphate aerosol concentrations and recent warming trends are accounted for. ….the overall large-scale pattern of observed near-surface temperature change over the 20th century is consistent with our understanding of the combined impacts of natural and anthropogenic forcings. Natural forcings were relatively more important in the early-century warming and anthropogenic forcings have played a dominant role in warming observed in recent decades ……global mean temperatures continue to increase at a rate similar to that observed over the last three Decades [in response to predicted future trends in greenhouse gas emissions] Stott et al. 2000. Science 290:2133-2137.
1960 2000 2100 YEAR How Will Future CO2 Levels Drive Climate? Hummer Scenario Prius Scenario
Past and Future Changes in Great Lakes Region Climate RAINFALL DAILY MAX AIR TEMPERATURE Temp Change O F Precip Change %
Conservative Estimate of Climate Change by 2090 (i) 10 to 20% increase in rainfall (ii) 2 to 4 C increase in temperature
PART TWO IMPACTS ON LAKE ENVIRONMENTS
Conservative Estimate of Climate Change by 2090 (i) 10 to 20% increase in rainfall (ii) 2 to 4 C increase in temperature IMPACTS ON LAKES Rule of Thumb A 10% increase in rainfall is needed for each 10 C of warming In order to maintain existing water levels. Therefore (i) reduction in water levels (ii) increase in ice free periods (iii) increase in summer surface water temperatures (iv) increase in stratification period
Warmer, Open Waters Longer Ice Free Period
Do recent historical trends reflect these projections for the future???
Lake Erie: Historical Changes in Winter Duration and Summer Surface Temperatures From: Jones, M et al. 2006. Canadian Journal of Fisheries and Aquatic Sciences
Annual 5 Year Moving Average WINTER DURATION: Monitoring the Intensity and ‘Visibility’ of Change ….smoothing annual observed variation reveals longer term trends……
Lake Erie 1900-2000: Winter Duration – Summer Water Temperature Winter Duration 1900-2000 5 year running averages Mid-Summer Surface Temperature 1900-2000 5 year running averages YEAR 1900 - 2000
Summer Mean Surface Temperature Versus Year by Basin For 4 Great Lakes ONTARIO* 1970-2000 Summer Surface Water Temps ERIE* 1970-2000 Summer Surface Water Temps HURON* 1970-2000 Summer Surface Water Temps Western Central Eastern Air SUPERIOR** 1980-2005 Summer Temps: Air & Surface Water Water • Dobiesz and Lester, In Prep. • **Austin and Colman, 2007, Geophysical Research Letters,Vol. 34.
LAKE SUPERIOR (1980-2005) SUMMER WINTER Summer Air and Water Temps Ice Cover Spring Stratification Date From: Austin and Colman, 2007, Geophysical Research Letters, Vol. 34.
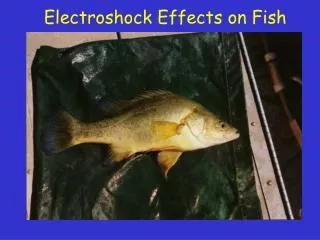
PART THREE • IMPACTS ON FRESHWATER FISH OF: • Less water, • Longer ice free periods • Warmer surface water temperatures *
Choose 2 C growth Preferred Temperature temperature
Kling, G.W. et al.. 2003. Confronting climate change in the Great Lakes Region. Union of Concerned Scientists and Ecological Society of America, Washington, D.C.
Typical Representatives of Each Thermal Guild Cold Cool Warm
Correspondence Between Physiological Preference and Climate at Northern Limit of Range Ann Mean Tp Cold Cool Warm absent Preferred Temperature common Lowest Yearly Mean Air Temp Where Species Found Impose a Climate Map of annual Air temperature Isotherms on the Distribution Map For a Species and identify the
Physiological Preference and Climate at Northern Limit of Range absent sporadic Preferred Temperature Duluth- Manitowoc common Coldest Tolerable Climate Duluth-Manitowoc climate data from: http://data.giss.nasa.gov/gistemp/station_data/
+ ve ? - ve
Some Winners and Losers ….. Losers Winners From: Mandrak, N. 1989. Journal of Great Lakes Research.
Assessing impacts of warming on a walleye population…… + ve ? - ve
Example: Walleye in Lake Erie Zoogeographic Range: 30 to 70 North Latitude Preferred temperatures: 20-25 C
Impact of Climate Change on Supply of Suitable Walleye Habitat in Lake Erie
LAKE ERIE Three Basins: west = smaller and shallow central = largest and a bit deeper east = smaller and very deep Less Water Longer Ice Free Period Warmer, Open Waters SEE: Jones et al. 2006. Canadian Journal of Fisheries and Aquatic Sciences 63:457-468.
Lake Erie East smaller, very deep Central smaller, shallow larger, deeper West
Defining Suitable Optical Habitat WALLEYE PREFERENCES Defining Suitable Thermal Habitat
IF Changes in Climate Affect the Quantity and Quality of Habitat Available to Individual Populations THEN How Will Sustainable Harvests Change?
supply quality Impacts of Declines in Both Habitat Supply and Habitat Quality on Sustainable Harvests harvest
(= Habitat Supply) Given: Change in habitat supply ~ = Change in sustainable harvests
General Impacts of Likely Changes in Climate on Fish Ecology & Consequences for Fisheries.
Adapting to Climate Change Water conservation increased demand for direct human uses may lead to severe reductions in habitat supply Refocus fishing on populations whose productivity is improved by climate change. Protect populations whose productivity is damaged by climate change Reduce impacts from other agents of stress: Eg: - mitigate impacts of contaminants - limit competition between humans and fish for water - control access of invasive species Actively accelerate northward shift of warmwater species AND / OR Actively protect coldwater species from competition with warmwater species
TAKE HOME MESSAGES 1. Climate change is underway. 2. Some future change is unavoidable – however, if limited, the impact of this change on aquatic environments can be evaluated and planned for. 3. Delaying control of greenhouse gases will accelerate the rate and magnitude of future change and thus render planning and mitigation difficult, and perhaps impossible.
Acknowledgements Ontario Ministry of Natural Resources University of Toronto, Fisheries and Oceans Canada, Natural Sciences and Engineering Research Council of Canada, Union of Concerned Scientists, Ecological Society of America and Norene Dobiesz, Karen Ing, Mike Jones, Nigel Lester, Ken Minns, Phil Ryan, Li Wang, Yingming Zhao
For Michigan, summers in 2030 could be like those in Kentucky, while by the end of the century, they may feel like ones in Arkansas today. Kling, G.W. et al. Zack. 2003. Confronting climate change in the Great Lakes Region. Union of Concerned Scientists and Ecological Society of America, Washington, D.C.
Frequency and severity of droughts may also increase in central North America Central North America Today 60 40 ~2070 Return Period (years) 20 0 10 15 20 25 30 Length of Dry Spell (days) Longer and more often…….. Kling, G.W. et al. Zack. 2003. Confronting climate change in the Great Lakes Region. Union of Concerned Scientists and Ecological Society of America, Washington, D.C.