Disproportionality
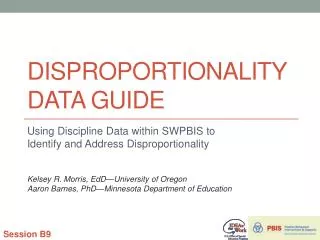
Disproportionality. Leslie Pyper OSPI, Special Education Leslie.pyper@k12.wa.us. What is Disproportionality?. students of a specific ethnicity or race over-represented or under-represented. Over-rep. Under-rep.

Disproportionality
E N D
Presentation Transcript
Disproportionality Leslie Pyper OSPI, Special Education Leslie.pyper@k12.wa.us
What is Disproportionality? students of a specific ethnicity or race over-represented or under-represented Over-rep Under-rep
Disproportionality is especially apparent for African American males in high-incidence categories such as mental retardation and emotional disturbance. Oswald, Coutinho and Best (2000) African American students are the most overrepresented group in special education programs in nearly every state, and … disproportionate representation is most pronounced in MR and ED Skiba, Russell J., et al. (2006)
The professional literature distinguishes between judgmental & non-judgmental disability categories nonjudgmental or low-incidence (hard) Deafness Blindness Orthopedic impairment Severe mental retardation judgmental or high-incidence (soft) Specific learning disability Mental retardation Emotional disturbance
1998 – 2004 students served under IDEA • All 6 -21 yr-olds increased less than 1 % • American Indian/Alaska Native students increased 4 % • (from 10 to 14 percent) • Six million 6 to 21 yr-olds were served in 2004 • (9 % of total population) • 14% of American Indians/Alaska Natives • 13 % of Blacks • 9 % of Whites • 8 % of Hispanics • 5 % of Asians/Pacific Islanders KewalRamani, A., Gilbertson, L., Fox, M., and Provasnik, S. (2007). Status and Trends in the Education of Racial and Ethnic Minorities (NCES 2007-039). National Center for Education Statistics, Institute of Education Sciences, U.S. Department of Education. Washington, DC.
To believe with certainty, we must begin by doubting.Polish Proverb
Risk Ratio for American Indian and Alaska Native MR – Fall 2006 1.5 – 1.99 2 and 3 WRRC presentation Above 3
Risk Ratio for American Indian and Alaska Native ED– Fall 2006 1.5 – 1.99 2 and 3 WRRC presentation Above 3
American Indian/Eskimo Censusscope.org
Risk Ratio for African American MR – Fall 2006 1.5 – 1.99 2 and 3 WRRC presentation Above 3
Risk Ratio for African American ED – Fall 2006 1.5 – 1.99 2 and 3 WRRC presentation Above 3
African American Censusscope.org
Dr. Billy C. Hawkins became the 20th President of Texas College in Tyler, Texas in 2000. http://www.ferris.edu/htmls/alumni/c&g/spring2003/hawkins.htm He moved on to become President of Talladega College on January 1st, 2008.
Billy C. Hawkins was labeled “educable mentally retarded” and placed in special education from 3rd -10th grade…
Doubt is uncomfortable, certainty is ridiculous. -Voltaire (François-Marie Arouet)
In Washington… Dec 2008 Childcount Oct 2008 Enrollment % of pop. in Spec Ed % spec ed (## spec ed) % enrolled (## enrolled) 4.0% (4,477) 4.7% (5,318) 7.5% (8,402) 15.3% (17,060) 68.3% (76,069) 2.6% (27,363) 16.3% AmInd/AN 8.6% (89,231) 6% Asian/PI 5.5% (56,790) 14.8% Black 15.3% (158,612) 10.7% Hispanic 68% (672,350) 11.3% White
06/07 – 08/09 WA weighted risk ratios State = aggregate data Districts can vary widely Buildings can vary widely within a district ‘All’ special education STATE Totals over over under “1.0” means an equal likelihood (or risk) as all other students
06/07 – 08/09 WA weighted risk ratios STATE Totals Specific categories
Washington State 2008 (6-21 yr olds)
NAS Statement In terms of cognitive and behavioral competence, students fall along a continuum… there is no black and white distinction between those who have disabilities or gifts and those who do not. A variety of forces push on the lines from opposing directions…
NAS Statement (cont’d) We have argued that where along the continuum of achievement the lines are drawn for specialized education is artificial and variable. Perhaps of greater concern, however, are factors that affect where a student falls along the continuum.For students having difficulty in school who do not have a medically diagnosed disability, key aspects of the context of schooling itself, including administrative, curricular/instructional, and interpersonal factors, may contribute to their identification as having a disability and may contribute to the disproportionately high or low placements of minorities...(Donovan & Cross, 2002, pp. 25-27)
Table 1 = 80-100% in gen ed setting Table 2 = 40-79% Table 3 = 0-39% 50 States and DC, including BIE schools So, who is separated most from their peers?
“…there are two prevalent trends in the data: once identified, minority students from every major racial group are more likely than white students with disabilities to be removed from the general education classroom for all or part of their school day ; and black students are most often over-identified in the disability categories that have the highest correlation with isolation from the general education setting, mental retardation and emotional disturbance.” Garcia Fierros, Edward, & Conroy, James W. (2002) Double Jeopardy: An Exploration of Restrictiveness and Race in Special Education. In Losen & Orfield (Eds.) Racial Inequity in Special Education (39-70). Cambridge, MA: Harvard Education Press
Once students are receiving special education services, they tend to remain in special education classes and they are likely to encounter a limited, less rigorous curriculum (Harry & Klingner, 2006)Students who enter special education 2+ years below age mates can expect to maintain disparity or fall farther behind.
“the research does suggest that unconscious racial bias, stereotypes, and other race-linked factors have a significant impact on the patterns of identification, placement, and quality of services for minority children, and particularly for African-American children. Losen, D. & Orfield, G. (2002). Introduction. In D. Losen & G. Orfield (Eds.) Racial Inequity in Special Education . Cambridge, MA: Harvard Education Press.
Some Hypotheses Why? • Failure of general education to educate children from diverse backgrounds • Misidentification, misuse of tests • Lack of access to effective instruction * • Insufficient resources • Teachers who are less well prepared • Poverty NICHCY National Dissemination Center for Children with Disabilities www.nichcy.org
34 CFR 300.306 • (b) Special rule for eligibility determination. • A child must not be determined to be a child • with a disability under this part— • If the determinant factor for that determination is— • Lack of appropriate instruction in reading, • Lack of appropriate instruction in math; or • (iii) Limited English proficiency; *Also in WAC 392-172A-03040
Things that make you go “hmmmm…”
Challenges to the “poverty theory”: Daniel Losen (2002) There are gross racial disparities for Blacks compared to Whites and Hispanics in mental retardation and emotional disturbance, but not… in medically diagnosed disabilities; b) There are dramatic differences in the risk for disability from one state to the next;
Hispanics have substantially lower risk for mental • retardation and emotional disturbance compared to Whites, and even lower compared to Blacks, even though Hispanics and Blacks share a far greater risk for poverty, exposure to environmental toxins and low academic achievement; and • There are large disparities in cognitive disability • identification rates between boys and girls generally, and especially between Black boys and girls. Minority Overrepresentation and Underservicing in Special Education.Losen, Daniel J.; Principal; Jan 2002; 81(3); p. 45 (EJ637130)
“…these results must be seen as consistent with a body of literature that has failed to establish any reliable relationship between rates of poverty and disproportionate placement in special education” “The effects of poverty cannot satisfactorily explain racial disparities in identification for mental retardation or emotional disturbance.”
Disproportionality is a very complex issue with many contributing factors. There is not one cause, nor one solution.
“Not surprisingly, overrepresentation data for black students in special education mirror overrepresentation in such undesirable categories as dropping out, suspension and expulsion, low-track placement, involvement with juvenile justice, and underrepresentation in Advanced Placement (AP) and gifted classes.” “The most effective remedies will go beyond the special education evaluation process and entail regular education reforms.” Losen, D. & Welner, K. G. (2002). Legal Challenges to Inappropriate and Inadequate Special Education for Minority Children. In D. Losen & G. Orfield (Eds.) Racial Inequity in Special Education (pgs. 167-194) . Cambridge, MA: Harvard Education Press.
Who gets suspended from school and why: A demographic analysis of schools and disciplinary infractions in a large school district Raffaele Mendez, L. M., & Knoff, H. M. (2003). Who gets suspended from school and why: A demographic analysis of schools and disciplinary infractions in a large school district. Education and Treatment of Children, 26(1), 30-51. “Based on the data from a number of diverse studies, it appears that school suspension is being used with increasing frequency, in a disproportionate manner relative to minorities, and for infractions that should be handled with less intensive disciplinary strategies. Moreover, these studies indicate that school suspension often is not successful in decreasing students’ chronic and inappropriate behavior, and it is related to a variety of negative academic and educational outcomes for students.” Discipline
Florida Study: 12th largest district in the nation Elementary Black males >3x as likely as White or Hispanic males Black females > 8x as likely as White or Hispanic females • Middle school • Males: Black 48.9% 127.06 per 100 B males • White 25% 52.41 per 100 W males • Females: Black 31.88% 69.13 per 100 B females • White 9.28% 16.47 per 100 W females • Across all 3 levels • Black males 2x as likely as White males • Black females >3x as likely as White females
Looking at all of Indiana’s schools, disproportionality is greatest at suburban schools Discipline and Disproportionality in the New IDEIA www.nccrest.org/events/cec_2006_HO.ppt Rausch & Skiba, 2004 Indiana study
Who gets suspended from school and why: A demographic analysis of schools and disciplinary infractions in a large school district Raffaele Mendez, L. M., & Knoff, H. M. (2003). Who gets suspended from school and why: A demographic analysis of schools and disciplinary infractions in a large school district. Education and Treatment of Children, 26(1), 30-51. “Given the intensity of a disciplinary action where a student is barred from attending school and the concomitant loss of instruction and academic engaged time, one might think that only the most egregious behaviors would result in school suspension. However, contrary to popular belief, most out-of-school suspensions across the country are for minor infractions of school rules rather than for dangerous or violent acts.”
For What Behaviors are Students Referred? • White students referred more for: • Smoking • Vandalism • Leaving w/o permission • Obscene Language • Black students referred more for: • Disrespect • Excessive Noise • Threat • Loitering Of 32 infractions, only 8 significant differences: Discipline and Disproportionality in the New IDEIA www.nccrest.org/events/cec_2006_HO.ppt
What does getting suspended have to do with disproportionate representation in special education? Could they be connected?
“the effective use of suspension begins first and foremost with establishing a school environment that teaches, promotes and facilitates appropriate, pro-social behavior.” “Suspension alone is unlikely to significantly reduce misbehavior, especially among students who do not find the school environment to be particularly reinforcing.”
Percentage distribution of students across NAEP reading achievement levels, by race/ethnicity and grade: 2007 National http://nces.ed.gov/nationsreportcard/nde/criteria.asp SOURCE: U.S. Department of Education, National Center for Education Statistics, National Assessment of Educational Progress (NAEP), 2003 Reading Assessment.