Biodiversity
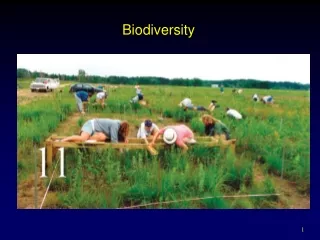
Biodiversity. Average Size. Measure all trees in a transect or quadrat. Produce a size-frequency histogram to show the size distribution. Can also calculate the average size tree. Quadrat Sampling. Randomly select plots and count all individuals in that plot. Each quadrat = 200m 2 .


Biodiversity
E N D
Presentation Transcript
Average Size • Measure all trees in a transect or quadrat. • Produce a size-frequency histogram to show the size distribution. • Can also calculate the average size tree.
Quadrat Sampling • Randomly select plots and count all individuals in that plot. • Each quadrat = 200m2. • Can calculate density as #/m2 then multiply by total area to estimate the total # of trees. • 60,703 m2 = 15 acres
Transect Sample • Randomly select a transect of known area and count every tree in that transect. • Each transect = 90m2. • Can calculate density for each tree species. • 60,703 m2 = 15 acres
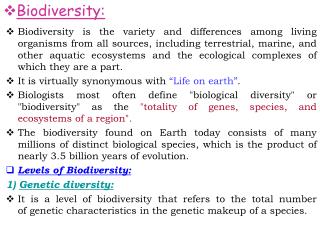
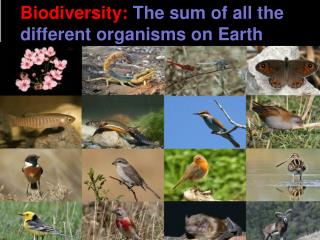
Measuring Biodiversity • The simplest measure of biodiversity is the number of species – called species richness. • Usually only count resident species, and not accidental or temporary immigrants • Another concept of species diversity is heterogeneity: Heterogeneity is higher in a community where there are more species and when the species are more equally abundant.
Diversity Indices • A mathematical measure of species diversity in a community. • Reveals important information regarding rarity and commonness of species in a community.
H= - pi(lnpi) Larger H = more diversity Shannon-Wiener Diversity Index (H) • Variables associated with the Shannon-Weiner Diversity index: • S – total number of species in the community (richness) • pi – proportion of S made up of the ith species • Hmax = ln(S) • EH – equitability (evenness; b/t 0 and 1) = H / Hmax
Species richness and equitability affect the Shannon Wiener index.
D= 1 - pi2ranges from 0 to 1 Simpson’s Index • N = total number of individuals • pi = proportion of each species • Simpson’s Index of Diversity = 1 – D • Ranges from 0 to 1 Low to high diversity