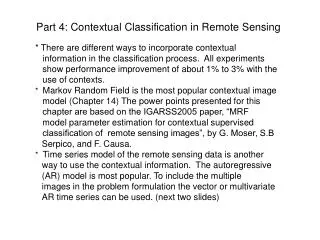
Remote Sensing Classification Accuracy
Remote Sensing Classification Accuracy. 1. Select Test Areas. Selecte test areas in an image to evaluate the accuracy of a classification Test areas should be representative categorically and geographically Sampling methods: uniform wall-to-wall, random, stratified random sampling

Remote Sensing Classification Accuracy
E N D
Presentation Transcript
1. Select Test Areas • Selecte test areas in an image to evaluate the accuracy of a classification • Test areas should be representative categorically and geographically • Sampling methods: uniform wall-to-wall, random, stratified random sampling • Sample size: 50 - 100 pixels each category
2. Error Assessment • A classification is not complete until its accuracy is assessed • Error matrix • KHAT statistics
Error Matrix • Also called confusion matrix and contingency table • Compares the ground truth and the results of the classification for the test areas • Can be used to evaluate the result of classifying the training set pixels and the results of classifying the actual full-scene
ClassifiedReference DataDataWater Sand Forest Urban Corn Hay Row Total Water480 0 5 0 0 0 485 Sand 0 52 0 20 0 0 72 Forest 0 0 313 40 0 0 353Urban 0 16 0 126 0 0 142 Corn 0 0 0 38 342 79 459 Hay 0 0 38 24 60 359481 Col Total 480 68 356 248 402 4381992 Error Matrix Diagonal cells are correctly classified pixels correctly classified pixels 1672 Overall accuracy = ------------------------------- = ------- = 84% total pixels evaluated 1992
ClassifiedReference DataDataWater Sand Forest Urban Corn Hay Row Total Water480 0 5 0 0 0 485 Sand 0 52 0 20 0 0 72 Forest 0 0 313 40 0 0 353Urban 0 16 0 126 0 0 142 Corn 0 0 0 38 342 79 459 Hay 0 0 38 24 60 359481 Col Total 480 68 356 248 402 4381992 Error Matrix In this case, the non-diagonal column cells are omission errors e.g. omission error for forest = 43/356 = 12% The non-diagonal row cells are commission errors e.g. commission error for corn 117/459 = 25%
ClassifiedReference DataDataWater Sand Forest Urban Corn Hay Row Total Water480 0 5 0 0 0 485 Sand 0 52 0 20 0 0 72 Forest 0 0 313 40 0 0 353Urban 0 16 0 126 0 0 142 Corn 0 0 0 38 342 79 459 Hay 0 0 38 24 60 359481 Col Total 480 68 356 248 402 4381992 Error Matrix correctly classified in each category producer's accuracy = ---------------------------------------------- the total pixels used in the category (col total) Omission error = 1 (100%) - producer's accuracy
ClassifiedReference DataDataWater Sand Forest Urban Corn Hay Row Total Water480 0 5 0 0 0 485 Sand 0 52 0 20 0 0 72 Forest 0 0 313 40 0 0 353Urban 0 16 0 126 0 0 142 Corn 0 0 0 38 342 79 459 Hay 0 0 38 24 60 359481 Col Total 480 68 356 248 402 4381992 Error Matrix correctly classified in each category user's accuracy = ------------------------------------------------------- the total pixels used in the category (row total) Commission error = 1 (100%) - user's accuracy
KHAT Statistics • A measure of the difference between the actual agreement between reference data and the results of classification, and the chance agreement between the reference data and a random classifier
KHAT Statistics ^ observed accuracy - chance agreement k = -------------------------------------------------- 1 - chance agreement • The KHAT value usually ranges from 0 to 1 • 0 indicates the classification is not any better than a random assignment of pixels • 1 indicates that the classification is 100% improvement from random assignment
KHAT Statistics r r N × S xii - S (xi+ × x+i) ^ i=1 i=1k = ----------------------------------- r N2 - S (xi+ × x+i) i=1 r - number of rows in the error matrix xii - number of obs in row i and column i (the diagonal cells) xi+ - total obs of row i x+i - total obs of column i N - total of obs in the matrix
KHAT Statistics • KHAT considers both omission and commission errors
Readings • Chapter 7