Numerical Measures
Numerical Measures. Central Tendency, Variation, Relative Standing, Skewness , Box Plots. Parameter vs. Statistic. Parameter: numerical value that describes the population Statistic: numerical value that describes the sample. I. Measures of Central Tendency. Mean. Example.

Numerical Measures
E N D
Presentation Transcript
Numerical Measures Central Tendency, Variation, Relative Standing, Skewness, Box Plots
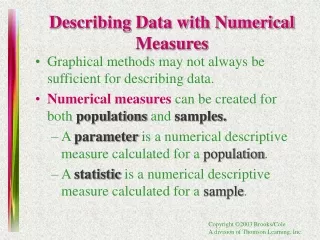
Parameter vs. Statistic • Parameter: numerical value that describes the population • Statistic: numerical value that describes the sample PLBautista
I. Measures of Central Tendency • Mean PLBautista
Example • The following data shows the number of hours of watching television in a week for a sample of 5 observations: • What is the sample mean? 3 5 7 7 13 PLBautista
I. Measures of Central Tendency • Median • Value “in the middle” of the data set (IMPORTANT: The data must be in increasing order) • For data with even no. of observations: average of the two middle values • More useful for data with extreme values PLBautista
I. Measures of Central Tendency • Mode • Most frequently occurring value • More useful for qualitative data PLBautista
Example • Compute the mean and median for the following data sets: • 96 97 100 100 101 101 105 • 75 77 90 100 108 117 133 PLBautista
II. Measures of Variation/Spread • Range • Variance PLBautista
II. Measures of Variation/Spread • Standard Deviation PLBautista
Coefficient of Variation • Useful for comparing the spread between data sets with different units PLBautista
Exercise For the following data set, compute • Mean • Median • Mode • Range • Variance • Standard deviation • Coefficient of Variation 53 55 57 53 69 70 57 59 52 53 PLBautista
III. Measures of Relative Standing IMPORTANT: For the following, data has to be arranged in increasing order! • Percentiles • The position of the ith percentile is given by • If not an integer, round up! • If is an integer, is the average of the and observation PLBautista
III. Measures of Relative Standing • Deciles • The position of the ithdecileis given by • Quartiles • The position of the ithquartile is given by PLBautista
IV. Measure of Skewness • Skewness is the measure of the distribution of values in the data set PLBautista
http://www.southalabama.edu/coe/bset/johnson/lectures/lec15_files/image014.jpghttp://www.southalabama.edu/coe/bset/johnson/lectures/lec15_files/image014.jpg PLBautista
V. Other Forms of Data Description • Box Plots • Useful for comparing multiple data sets PLBautista
Five-Number Summary • Smallest Value • Q1 • Q2 • Q3 • Largest Value PLBautista
V. Other Forms of Data Description • Stem-and-Leaf Display PLBautista