Numerical Measures of Variability
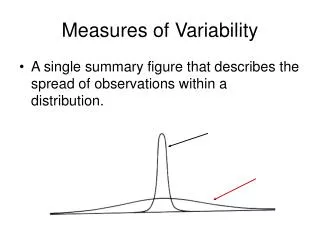
Numerical Measures of Variability. Measures of Variability. Measures of Variability are a set of characteristics that examine the dispersion or spread of the distribution that the researcher may be interested in.


Numerical Measures of Variability
E N D
Presentation Transcript
Measures of Variability Measures of Variability are a set of characteristics that examine the dispersion or spread of the distribution that the researcher may be interested in. This group describes the amount of variability (spread, dispersion, difference) in a set of values. Range, Interquartile Range, Variance, Standard Deviation, and Coefficient of Skewness
Range The range is the difference between the highest value and the lowest value. Ex. If the highest value is 20 and the lowest value is 2, the range is 18. The range can be reported as 18 or that the “values range from 2 to 20”.
Interquartile Range The interquartile range measures the range of the middle 50% of an ordered data set. not effected by outliers still preserves the idea of the range In finding the interquartile range, we actually locate the 25th, 50th, & 75th quartiles
Interquartile Range Steps to finding the Interquartile Range 1. Rank order the data, Find the Median, Mark that value with Q2 (this is the 50th quartile) 2. Find the Median of the Lower 50% w/o including the Q2 value, Mark that value with Q1 (this is the 25th quartile) 3. Find the Median of the Upper 50% w/o including the Q2 value, Mark that value with Q3 (this is the 75th quartile) 4. IQR = ( Q3 –Q1 )
Variance and Standard Deviation Most commonly reported and utilized measures of variability Can be influenced by outliers
Variance and Standard Deviation If the data is widely scattered, larger values
Variance The variance is the average squared amount of deviation from the mean. Generally used as a step toward the calculation of other statistics. Sample Variance (s2 ) = (x – x )2 / n - 1 Population Variance (σ2) = (x - µ)2 / N x2 = deviation scores squared
Standard Deviation The standard deviation is the average amount of deviation from the mean. It is the square root of the variance. Sample Standard Deviation (s) = (x - x)2/ n - 1 (s) = S2 Population Standard Deviation (σ) = (x - µ)2 / N (σ) = σ2
Variance and Standard Deviation Variance (s2 ) = (x – x )2/ n – 1 (s2 ) = 36/ 11 – 1 = 36/10 = 3.6 Standard Deviation (s) = S2 (s) = 3.6 = 1.8973 = 1.90 n = 11
Coefficient of Skewness To measure the skew of the distribution, Pearson’s coefficient of skewness is often found based on the relationship between the mean, median, and standard deviation Can range in values from -3 to +3
Coefficient of Skewness Mean = 10 Median = 7 S = 4 sk = 3(10 – 7)/4 = 3(3)/4 = 9/4 = 2.25 Data is positively skewed For our data set Mean = 9 Median = 9 S = 1.90 sk = 3(9 – 9)/1.90 = 3(0)/1.90 = 0/1.90 = 0 Data is normally distributed
Coefficient of Skewness Coefficients that are zero or near zero will have data that will display equal tails
Coefficient of Skewness Coefficients that are more positive in value will have data that displays a longer tail to the right
Coefficient of Skewness Coefficients that are more negative in value will have data that displays a longer tail to the left