Measures of Variability
Measures of Variability. Variability. Measure of the spread or dispersion of a set of data 4 main measures of variability Range Interquartile range Variance Standard deviation. Range. Difference between high and low scores Provides estimate of variability Very unstable


Measures of Variability
E N D
Presentation Transcript
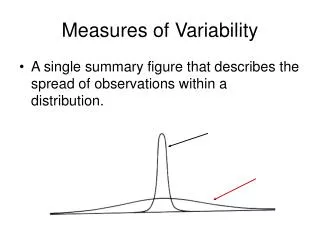
Variability • Measure of the spread or dispersion of a set of data • 4 main measures of variability • Range • Interquartile range • Variance • Standard deviation
Range • Difference between high and low scores • Provides estimate of variability • Very unstable • Changes radically if extreme scores are present in the data set
Interquartile Range (IQR) • Difference between the raw scores at the 75th and 25th percentile points • IQR = Q3 - Q1 • More interested in the middle scores than in the extreme scores • Only considers middle half of data set • Not affected by scores at extreme ends
Variance • Determines the distance of each raw score from the mean of the data • Deviation • d
Variance • Average of the squared deviations
Standard Deviation • Squaring of deviation scores can cause problems • Need to bring variance into line with other variability measures • Standard deviation • A measure of the spread of the values in a parametric data set standardized to the scale of the unit of measurement of the data • Square root of the average of the squared deviations from the mean
Standard Deviation of a Population • Definition method • Can be cumbersome and lengthy procedure • Especially when N is large • Increased probability of mathematical error
Raw Score Method • Algebraic manipulation of definition method to allow for the use of raw scores • Simpler to apply • Squaring and summing of raw scores
Calculating Standard Deviation for a Sample • Sample is drawn from the population • Sample smaller than population • Sample should be representative of the population • Variability of sample is rarely as large as that of the population • Correction factor needed in equation is needed to estimate the SD for the population from the sample
Calculating Standard Deviation for a Sample • Equations already presented assume entire population has been sampled • Error occurs when using these equations for a sample • Degrees of freedom • Number of values in a data set that are free to vary • Correction factor • N-1
Equations • Definition formula • Raw score method