Download
1 / 24
280 likes | 920 Vues
Chapter 5: Measures of Variability. The Importance of Measuring Variability IQV (Index of Qualitative Variation) The Range IQR (Inter-Quartile Range) Variance Standard Deviation Considerations for choosing a measure of variation. The Importance of Measuring Variability.

E N D
Chapter 5:Measures of Variability • The Importance of Measuring Variability • IQV (Index of Qualitative Variation) • The Range • IQR (Inter-Quartile Range) • Variance • Standard Deviation • Considerations for choosing a measure of variation
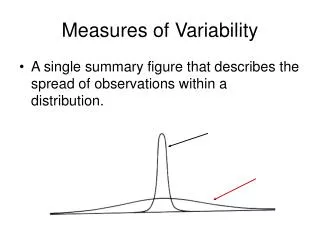
The Importance of Measuring Variability • Central tendency - Numbers that describe what is typical or average (central) in a distribution • Measures of Variability - Numbers that describe diversity or variability in the distribution. These two types of measures together help us to sum up a distribution of scores without looking at each and every score. Measures of central tendency tell you about typical (or central) scores. Measures of variation reveal how far from the typical or central score that the distribution tends to vary.
Notice that both distributions have the same mean, yet they are shapeddifferently
Index of Qualitative Variation • IQV – A measure of variability for nominal variables. It is based on the ratio of the total number of differences in the distribution to the maximum number of possible differences within the same distribution. IQV = K(1002 - Σf 2) 1002 (K-1) Where K= the number of categories N= the total number of cases in the distribution Σf 2= the sum of all squared frequencies or percentages
Understanding the Index of Qualitative Variation • The IQV is a single number that expresses the diversity of a distribution. • The IQV ranges from 0 to 1 • An IQV of 0 would indicate that the distribution has NOdiversity at all. • An IQV of 1 would indicate that the distribution is maximally diverse.
Racial diversity • Table 5.1 • Figure 5.2 • Table 5.2
IQV can be expressed as a percentage • Multiply IQV by 100 • Percentage of actual difference relative to maximum possible difference in a distribution.
The Range Range = highest score - lowest score • Range – A measure of variation in interval-ratio variables. It is the difference between the highest (maximum) and the lowest (minimum) scores in the distribution.
Table 5.5 • Percentage change in the elderly population
Simple and quick to calculate, yet crude because it is based on only the lowest and highest scores. • These two scores might be extreme and rather atypical, making range a misleading indicator of variation in the distribution.
Inter-Quartile Range • Inter-Quartile Range (IQR) – A measure of variation for interval-ratio data. It indicates the width of the middle 50 percent of the distribution and is defined as the difference between the lower and upper quartiles (Q1 and Q3.) • IQR = Q3 – Q1
Also based on two scores. • Because it is based on intermediate scores rather than extreme scores, it avoids some of the instability associated with the range. • Table 5.6 • Compare range and IQR
The difference between the Range and IQR These values fall together closely Shows greater variability Importance of the IQR Yet the ranges are equal!
The Box Plot • The Box Plot is a graphic device that visually presents the following elements: the range, the IQR, the median, the quartiles, the minimum (lowest value,) and the maximum (highest value.)
Box plots are useful for comparing distributions. • Figure 5.5 • Figure 5.6
Variance • Variance– A measure of variation for interval-ratio variables; it is the average of the squared deviations from the mean
Table 5.7 • Regional variation in the elderly population. • Do figures cluster or are dispersed around the mean? • Close to average vs. deviate from the average
How much, on average, each score in the distribution deviates from a central ponit (the mean)? • Mean is the reference point because it is based on all the scores in the distribution.
Table 5.8 • Figure 5.7 • Table 5.9
Standard Deviation • Standard Deviation – A measure of variation for interval-ratio variables; it is equal to the square root of the variance.
Comparing two distributions • Table 5.10 • Figure 5.8
Considerations for Choosing a Measure of Variability • For nominal variables, you can only use IQV (Index of Qualitative Variation.) • For ordinal variables, you can calculate the IQV or the IQR (Inter-Quartile Range.) Though, the IQR provides more information about the variable. • For interval-ratio variables, you can use IQV, IQR, or variance/standard deviation. The standard deviation (also variance) provides the most information, since it uses all of the values in the distribution in its calculation.