Download
1 / 21
210 likes | 329 Vues
This study presents methodologies for merging ocean color data from various satellite missions, including SeaWiFS and MODIS/Aqua. Utilizing error-weighted averaging and objective analysis, the research aims to create comprehensive maps of chlorophyll-a concentrations and spatial errors. By integrating observations from disparate sources, the analysis focuses on enhancing the accuracy of biogeochemical data in the ocean, particularly across different geographies. The ongoing work aims to refine these techniques for real-time applications in oceanographic research.

E N D
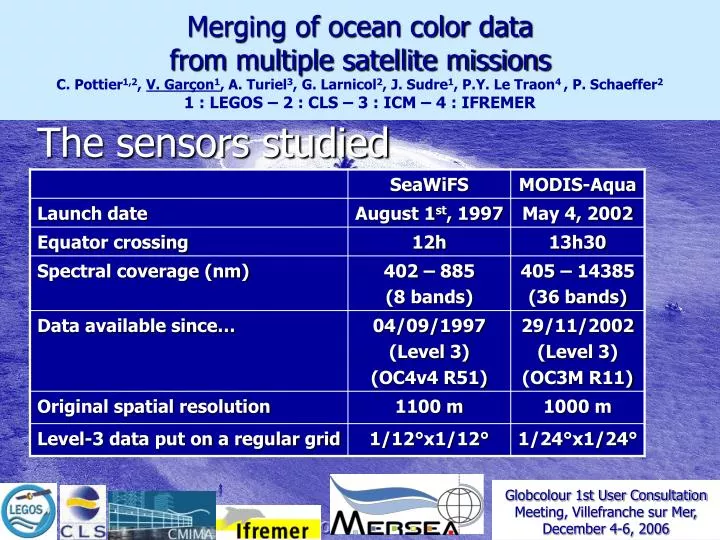
Merging of ocean color datafrom multiple satellite missionsC. Pottier1,2, V. Garçon1, A. Turiel3, G. Larnicol2, J. Sudre1, P.Y. Le Traon4 , P. Schaeffer2 1 : LEGOS – 2 : CLS – 3 : ICM – 4 : IFREMER The sensors studied Globcolour 1st User Consultation Meeting, Villefranche sur Mer, December 4-6, 2006
–Globcolour 1st User Consultation Meeting – Methods and zone of interest – 1 1 1 2 3 2 50 65 50 11 50 4 51 52 15 19 5 54 54 53 16 18 69 66 6 17 56 60 7 34 33 35 12 64 67 36 61 8 63 14 13 30 62 9 72 70 64 59 32 31 10 20 71 22 37 80 80 80 68 58 81 21 81 82 82 83 83 83 Methods and zone of interest • Error weighted-averaging • Objective analysis • Global application for 2003 • Wavelets (ongoing work) => Gulf Stream area Biogeochemical provinces [Longhurst, 1998]
SeaWiFS: 2410 matchups • YEAR 2003 • AMT 12 and AMT 13 (Atlantic Meridional Transect, UK) • SeaBASS (SeaWiFS Bio-optical And Storage System, USA) • National Oceanographic Data Center (USA) • International Council for the Exploitation of the Sea • National Institute of Oceanography (India) • OISO • MINERVE 0203-R2, 0204-R4, 0304-R0, and 0304-R1 • ARGAU3 • DIAPAZON 7, 8, and 9 • DYFAMED • Other cruises (Yves Dandonneau, pers. com.) MODIS/Aqua: 2789 matchups
SeaWiFS’ error measurement MODIS/Aqua’s error measurement % of chlorophyll % of chlorophyll
SeaWiFS’ bias MODIS/Aqua’s bias % of chlorophyll % of chlorophyll
Error-weighted averaging Objective analysis in Pottier et al., IEEE TGRS, 2006
– Globcolour 1st User Consultation Meeting - Error-weighted-averaging – Error-weighted averaging[Pottier et al., IEEE TGRS, 2006][Gregg et al., IOCCG Report, 2006] • Input parameters for each sensor: • Map of chlorophyll for the ith day • Map of spatial errors (according to matchups) • Computation made on logtransformed values • Output products: • Map of combined chlorophyll for the ith day • Map of associated errors
SeaWiFS Combined data MODIS/Aqua Chlorophyll-a concentration (mg/m^3) Error Spatial repartition of the data % of chlorophyll 03/26/2003
– Globcolour 1st User Consultation Meeting– Objective analysis – Objective analysis[Pottier et al., IEEE TGRS, 2006][Gregg et al., IOCCG Report, 2006] • Aim: to determine the value of a field at a point in space and time, given various measurements of the field unevenly spread over time and space obsi (i=1…n) • Best least squares linear estimator est(x) (Bretherton et al., 1976): • A priori knowledge of: • The covariance function (i.e. variance + correlation function) • The measurement noise and the bias (obtained from the matchups)
SeaWiFS Combined data MODIS/Aqua Chlorophyll-a concentration (mg/m^3) Error Spatial repartition of the data % of chlorophyll 03/26/2003
Wavelets Use of multi-resolution algorithm to compute the wavelet coefficients « h »: convolution with a low-pass filter « g »: convolution with a high-pass filter « 2 »: keep 1 row (or col.) on 2
– Globcolour 1st User Consultation Meeting– Wavelets – Wavelets [Pottier, Turiel and Garçon]1st step: estimation of the missing data Vertical details
– Globcolour 1st User Consultation Meeting– Wavelets – Wavelets [Pottier, Turiel and Garçon]2nd step: combination
SeaWiFS MODIS/Aqua Original image (1/12°) Original image (1/24°) 03/26/2003 Reconstructed image Reconstructed image Weighted averaging (1/12°) Wavelets (1/24°) Objective analysis (1/12°)
– Globcolour 1st User Consultation Meeting - Ongoing work – Ongoing work • Weighted averaging and objective analysis • Fully operational for near real time at the global scale • Statistics computation needed for all time series • Addition of other sensors (MERIS…) • Wavelets: very promising ! But still a lot of work to do !
Oceanographic application:using combined SeaWiFS and MODIS/Aqua ocean color data • Southern ocean (35°S – 50°S) • What are the dominant modes of variability in sea level anomalies and surface chlorophyll concentrations in this circumpolar belt ? (Pottier et al., 2004; Pottier et al., 2006)
2002-2006 period : 3/0 mode of variability Band 35°S-45°S Weekly sea level anomalies Monthly SeaWiFS chlorophyll Weekly combined chlorophyll SeaWiFS + MODIS/Aqua Band 45°S-50°S
– Globcolour 1st User Consultation Meeting– In conclusion – In conclusion : • Within MERSEA,
– Globcolour 1st User Consultation Meeting– Wavelets – Error