Normal Distribution 2
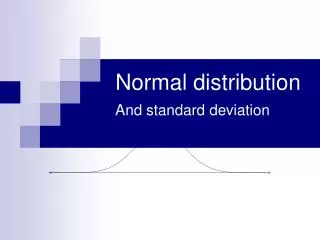
Normal Distribution 2. To be able to transform a normal distribution into Z and use tables To be able to use normal tables to find and To use the normal distribution to answer questions in context. Standard Normal Distribution.

Normal Distribution 2
E N D
Presentation Transcript
Normal Distribution 2 To be able to transform a normal distribution into Z and use tables To be able to use normal tables to find and To use the normal distribution to answer questions in context
Standard Normal Distribution X ̴ N(, ²) can be transformed into a Z score where Z ̴ N(0, 1²) • z = x - •
X ̴ N(50, 4²) so =50 and =4 Find P(x<53) z = 53 – 50 = 0.75 4 Find P(z<0.75) P(Z<0.75) = 0.7734
X ̴ N(50, 4²) so =50 and =4 Find P(x≤45) z = 45 – 50 = -1.25 4 Find P(z<-1.25) 1-0.8944 P(Z<-1.25) = 0.1056
Y ̴ N(20, 9) so =20 and =3 P(Y>b)=0.0668 z = b – 20 3 0.0668 1- 0.0668=0.9332 From tables Z=1.5 1.5 = b – 20 3 4.5 = b – 20 b = 24.5
P z = 20 – = 0.20 3 The random variable X ̴ N(,3²) Given P(X>20)=0.20, find the value of P=0.20 From tables Z=0.8416 0.8416 = 20 – 3 2.5248 =20– = 17.4752
The random variable X ̴ N(50, ²) Given P(X<46)=0.2119, find the value of P z = 46 – 50 = 0.2119 P=0.2119 P=0.7881 From tables Z=0.8 so on graph Z=-0.8 -0.8 = 46 –50 = -4/-0.8 = 5
The heights of a large group of women are normally distributed with a mean of 165cm and a standard deviation of 3.5cm. A woman is selected at random from this group.A) Find the probability that she is shorter than 160cm.Steven is looking for a woman whose height is between 168cm and 174cm for a part in his next film.B) Find the proportion of women from this group who met Steven’s criteria
H=heights of women H ̴ N(165, 3.5²) A) Find the probability that she is shorter than 160cm.Find P(x<160) z = 160 – 165 = 0.75 3.5 P(z < -1.43) P(z <1.43) = 0.9236 P(z < -1.43 = 1-0.923 = 0.1895
H=heights of women H ̴ N(165, 3.5²) B) Find P(168<x<174) z = 168 – 165 = 0.86 3.5 z = 174 – 165 = 2.55 3.5 P(z >0.86) = 0.8051 P(z < 2.55) = 0.9946 P(0.86 <z < 2.55) = 0.9946-0.8051 = 0.1895
P z <485 – 510 = 0.01 Boxes of chocolates are produced with a mean weight of 510g. Quality control checks show that 1% of boxes are rejected because their weight is less than 485g.A) Find the standard deviation of the weight of a box of chocolatesb) Hence find the proportion of boxes that weigh more than 525g. W=weights of box of chocolates W ̴ N(510, ²) P(W<485) = 0.01 485 – 510 = -2.3263 = 10.7
b) Hence find the proportion of boxes that weigh more than 525g. P(W > 525) z = 525 – 510 = 1.40 10.7 P(z > 1.40) = 1 – 0.9192 = 0.0808