Download
1 / 4
40 likes | 158 Vues
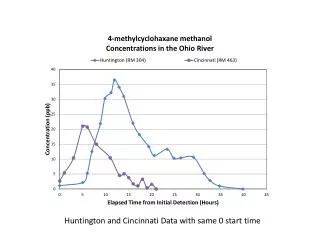
This project involves aligning Huntington and Cincinnati data that share the same start time in order to analyze peak concentrations. The primary axis is adjusted to place the Cincinnati zero detection point on the Huntington trace. Additionally, the secondary axis is modified to account for analytical differences, which may involve arbitrary reductions. The goal is to accurately read and compare concentrations for both datasets, ensuring that the starting concentrations are set to zero for both, facilitating a clearer comparative analysis.

E N D
Adjust the axis to align Cincinnati 0 detect point on Huntington trace Hypothesized Louisville Data (RM 604)
Adjust secondary axis to account for analytical differences (arbitrary reduction) and read concentration for both off primary axis, adjusting start concentration for each at 0.


![Time [~4600 – 0 Ma]](https://cdn3.slideserve.com/6035775/slide1-dt.jpg)

![data[0] data[1]](https://cdn3.slideserve.com/6657649/slide1-dt.jpg)