Download
1 / 26
260 likes | 447 Vues
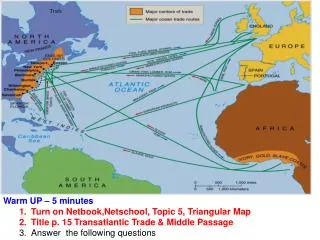
USMEF Pork Committee. Trade Overview Brett Stuart Trade Analyst, USMEF Denver. Outline. Global Trade Overview Forecasts Competition Outlook. 2004 Global Pork Trade. Stats through May (most recent global) Global trade: +11% U.S. +35%, comprises 22% of global trade

E N D
USMEF Pork Committee Trade Overview Brett Stuart Trade Analyst, USMEF Denver
Outline • Global Trade Overview • Forecasts • Competition • Outlook
2004 Global Pork Trade Stats through May (most recent global) • Global trade: +11% • U.S. +35%, comprises 22% of global trade • E.U. +10%, comprises 30% of global trade • Decreases • Canada: -2% • Brazil: -6% • Other minor country decreases due to global specialization?
Jan-Aug U.S. Pork/PVM ExportsTop 6 Markets 1994-2004 +32% in Volume +34% in Value Source: U.S. Census
U.S. Pork Increase to Mexico Source: World Trade Atlas
U.S. Pork Increase to Mexico • Beef and poultry image has been tainted by BSE, AI • Beef was banned for first 3 months • Mexico’s economy will increase by 4% this year and the same is expected next year • Middle class is strengthening as a consumer group
+44% +1% +15% +38% Source: USMEF
+57% -21% +94% +4% +20% -39% +34% +117% Source: USMEF
Jan-Aug 2004 Korean Imports +55% U.S. Exports -24% Source: World Trade Atlas
+57% -21% +94% +4% -39% +20% +34% +117% Source: USMEF
U.S. Pork/PVM Export Forecasts USMEF forecasts Source: USDA, USMEF Estimates
Denmark • Denmark increased frozen pork exports to Japan by 35% through August • Higher production • Favorable exchange rates • Export dependency Cheaper exports
Brazil • 2005 pork production to increase by 2% • Russian FMD ban on Brazilian pork amounts to approximately 30,000 mt / month or 70% of their 2004 export volumes • One Russian official announced that the ban will exist for at least 3 more months (mid October) • Pork exports will post a decline in 2004
EU 15 to 25 10 accession countries: • Pork production: 3.5 million mt • EU: 18.1 million mt • US: 9.1 million mt • Pork Imports: 216,949 mt • Pork Exports: 220,413 mt
Poland is now the 3rd largest pork producer in the EU Source: USDA
Factors to watch in 2005 • BSE bans • Mexico dumping case • Exchange rates • Russia’s Brazil ban • China • U.S. pork price and production
World Economic Growth Sources: Oxford Economic Forecasting; International Financial Statistics, IMF
Questions? Brett Stuart Trade Analyst 303-226-7316 bstuart@usmef.org Visit www.usmef.org