GLOBAL TRADE OVERVIEW
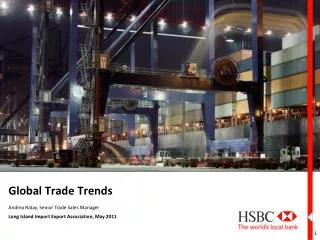
GLOBAL TRADE OVERVIEW. Workshop Favignana, 28-29 September, 2009 Audun Lem, FAO. Outline. World fish supply and demand utilization and consumption trade China prices Distribution trends Rise of aquaculture Conclusions. WORLD FISH SUPPLY. World fish production. World Fish Production.

GLOBAL TRADE OVERVIEW
E N D
Presentation Transcript
GLOBAL TRADE OVERVIEW • Workshop • Favignana, 28-29 September, 2009 • Audun Lem, FAO
Outline • World fish supply and demand • utilization and consumption • trade • China • prices • Distribution trends • Rise of aquaculture • Conclusions
World Fish Production aquaculture catch FISHSTAT 2007
Fish Utilization Feed Food uses
World aquaculture production: growing quickly: 1950-2008,but slowing down aquaculture
World Fish Trade: Export Value- in 1000 US$ - developing developed
WORLD FISH EXPORTS US$ 99.5 BILLION (2008) TRADE STILL GROWING in ‘08 + 7 % (2008) 2008 IMPORTS > USD 100 BILL for 1st time DEVELOPING COUNTRIES 50 % OF WORLD EXPORTS NET EXPORT REVENUES FROM FISHERIES CRUCIAL FOR MANY DEVELOPING COUNTRIES US$ 26 bill. (2008)
Share of world fisheries production destined to exports Million tonnes (live weight)
Main fish importers (2008) • Japan USD 14.5 bill. 13.8 % • US USD 14.1 bill. 13.5 % • EU USD 49.0 bill. 46.8 % • Total big 3 USD 77.6 bill. 74.1 % • Total world USD 104.7 bill. 100 %
Fish market trends • Japan: long-term decline but small rebound 2008 • high consumption: 65 kg/kaput • imports below 3 million tons in 2007 • USA: long-term growth, overtaking Japan as # 1 country • rising population and consumption /kaput 24 kg • consumer confidence falling in 2008 and 2009 • 2010 turn-around ? • EU: long-term growth: # 1 market • expanding population, stable consumption at 20 kg • rising imports: e.g. catfish from Viet Nam, mussels from Chile • South America • low average consumption, 9 kg per kaput, slow increase • large potential for increase • supply increase must come from aquaculture
Distribution • 71 % of world imports by three markets • within these markets: supermarkets represent 50-85 % of retail sales • concentration of sales whereas industry remains fragmented • same tendency in developing countries • at the same time: seafood retail net margins reportedly low compared to other food products
Future ? • Supply side: more concentration in aquaculture for some species (salmon, European bass/bream) • focus on costs, economies of scale • focus on marketing and distribution • Demand: retail concentration in developed and developing • But aquaculture has some advantages over wild: • traceability • contracts on price and volumes
The next China: Viet Nam • 2008: Nr 5 among world exporters • but a growing importer as well • reprocessing • domestic consumption
Commodity prices • fish versus other food
FUTURE FISH PRICES ? • DEMAND: slowly rising • because of population growth • small underlying increase in per kaput consumption • SUPPLY • capture: stable, not increasing • aquaculture: increasing but declining growth • PRICE IMPACT ? • most probably slightly higher fish prices but not much • price cycles in commodity markets • industry profitability through product development, technological innovation and cost reduction
TRADE CONTEXT • 153 countries now in WTO • Russia is ready to join (?): 2010 ? • China joined 2001, Viet Nam in 2007 • WTO: RULES BASED SYSTEM • tariffs • market access (SPS/TBT): quality and safety now main issue in market access • dispute resolution • Doha Round: 2001 - ? • market access (tariffs) • fisheries subsidies • Regional and bilateral trade agreements • proliferation • regional trade areas, like EU. • many South American countries active in bilaterals
AQUACULTURE FUTURE • fastest growing food producing sector in the world • accounts for almost 50% of the global food fish • 52 million tons of fish produced worth US$ 75 billion (2007) • Given the projected population growth, an additional 40 million tons of aquatic food needed by 2030 to maintain current per caput consumption.
2005 2015 2030 capture aquaculture
CONCLUSIONS • Fish has always been a globalised commodity • but of higher importance for developing countries than most other commodities • Fish production is increasing, but only thanks to aquaculture: 50% share in 2008 in food fish • Fish trade is increasing: almost USD 100 billion in 2008 • Fish trade: big 3 import 71 % but in decline • Outsourcing of production and of processing • Rise of China and Viet Nam, and Russia • Future: India ?