SEISMIC WAVE BASICS
SEISMIC WAVE BASICS. Finding an Epicenter. ESRT TABLES – GRAPH PAGE 11. http://www.youtube.com/watch?v=1qbg7orb1lc Video-Richter Scale. Measuring Earthquakes Measured using intensity and magnitude scales Mercalli (intensity) Richter Scale

SEISMIC WAVE BASICS
E N D
Presentation Transcript
Finding an Epicenter ESRT TABLES – GRAPH PAGE 11
http://www.youtube.com/watch?v=1qbg7orb1lc Video-Richter Scale Measuring Earthquakes Measured using intensity and magnitude scales Mercalli (intensity) Richter Scale Based on reports from people Based on Energy Released who experienced the earthquake by the earthquake. Depends on how far the person Each number is 10x larger was from the epicenter and the than the next. Buildings/infrastructure. Ex. Magnitude 4 is 10x more Measures the damage caused. Powerful than mag 3. http://earthquake.usgs.gov/earthquakes/world/world_deaths.php 10 Deadliest Earthquakes
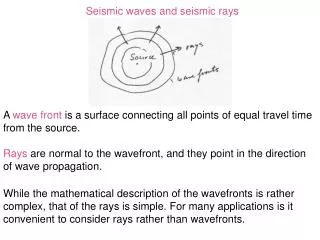
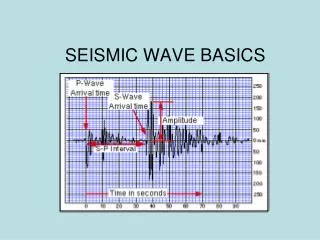
Locating Epicenters A standard chart is used to calculate the distance from the seismograph to the epicenter. ESRT What is the relationship between the time interval between P and S waves arrival and distance to an epicenter?
The greater the time interval between the arrival of the P & S waves the greater the distance to the epicenter (Further away).
Use the data from the recording stations: • Station A: San Francisco, California P-Wave arrival 3:02:20 S-Wave arrival 3:06:30 What is the time difference between P and S wave arrivals? 4:10
Determine distance to epicenter P – wave arrival is 3:02:20 AM. S – wave arrival is 3:06:30 AM. Differen in arrival times is 3:06:30 - 3:02:20 00:04:10 minutes Calculate the distance to the epicenter using the difference in arrival times (4min, 10sec). USE ESRT p. 11
TAKE A PIECE OF PAPER, AND MARK OFF THE DIFFERENCE IN ARRIVAL TIME 4:10 2800Km
Use the data from the recording stations: • Station B: Denver, Colorado P-Wave arrival 3:01:40 S-Wave arrival 3:05:00 What is the time difference between P and S wave arrivals? 3:20
Determine distance to epicenter P – wave arrival is 3:01:40 AM. S – wave arrival is 3:05:00 AM. Differen in arrival times is 3:05:00 - 3:01:40 00:03:20 minutes Calculate the distance to the epicenter using the difference in arrival times (3min, 20sec). USE ESRT p. 11
MOVE THE PAPER UNTIL THE TWO TICK MARKS LINE UP WITH THE P AND S CURVES WHEN TICK MARKS LINE UP, GO STRAIGHT DOWN AND READ THE EPICENTER DISTANCE EPICENTER DISTANCE OF 2000 KM
Use the data from the recording stations: • Station C: Missoula, Montana P-Wave arrival 3:01:00 S-Wave arrival 3:03:00 What is the time difference between P and S wave arrivals? 2:00
Determine distance to epicenter P – wave arrival is 3:01:00 AM. S – wave arrival is 3:03:00 AM. Differen in arrival times is 3:03:00 - 3:01:00 00:02:00 minutes Calculate the distance to the epicenter using the difference in arrival times (2min, 00sec). USE ESRT p. 11
MOVE THE PAPER UNTIL THE TWO TICK MARKS LINE UP WITH THE P AND S CURVES WHEN TICK MARKS LINE UP, GO STRAIGHT DOWN AND READ THE EPICENTER DISTANCE EPICENTER DISTANCE OF 1100 KM
Difference in arrival times: San Francisco, CA: 4:10´ Denver, CO: 3:20´ Missoula, MT: 2:00´
EPICENTER DISTANCES San Francisco, CA: 4:10 2,800 km Denver, Co: 3:20 2,000 km Missoula, MT 2:00 1,100 km
http://www.eram.k12.ny.us/education/page/download.php?fileinfo=RmluZGluZ0VwaWNlbnRlci5zd2Y6Ojovd3d3L3NjaG9vbHMvc2MvcmVtb3RlL2ltYWdlcy9kb2NtZ3IvNDQ2ZmlsZTU4NjIuc3dmhttp://www.eram.k12.ny.us/education/page/download.php?fileinfo=RmluZGluZ0VwaWNlbnRlci5zd2Y6Ojovd3d3L3NjaG9vbHMvc2MvcmVtb3RlL2ltYWdlcy9kb2NtZ3IvNDQ2ZmlsZTU4NjIuc3dm
Recording BoardDifference in arrival times: San Francisco: 41:0 2,800 km Line your compass up to the EXACT distance on the scale. Use the metric side (cm) beginning from zero. 0 3,000 2,000 4,000 5,000 1,000
Use your carefully set compass to draw a circle around each seismic station. . 1100 km . 2800 km 2000 km You've found a possible epicenter! Does this seem like a likely location for an earthquake to occur?
Compare your answer to the historical record Missoula Syracuse X San Francisco Denver