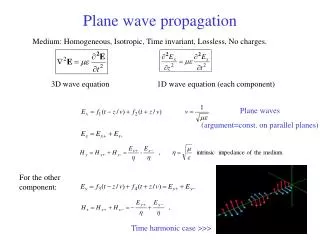
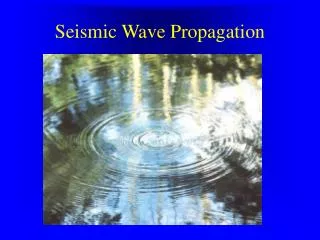
Visualizing seismic wave propagation
Visualizing seismic wave propagation. Peter van Keken University of Michigan Jeroen Tromp Dimitri Komatitsch Caltech Shalini Venkataraman Nicholas Schwarz Luc Renambot Jason Leigh University of Illinois at Chicago. American Geophysical Union, Fall 2003, ED31E-01.

Visualizing seismic wave propagation
E N D
Presentation Transcript
Visualizing seismic wave propagation Peter van Keken University of Michigan Jeroen Tromp Dimitri Komatitsch Caltech Shalini Venkataraman Nicholas Schwarz Luc Renambot Jason Leigh University of Illinois at Chicago American Geophysical Union, Fall 2003, ED31E-01
Seismology in intro geophysicsUniversity of Michigan GS420 • Elastic deformation/wave equation • Refraction, reflection • 1D earth structure • Earthquakes and seismograms • Tomography • Attenuation, anisotropy • www.geo.lsa.umich.edu/~keken/420.html
PcP PKIKP shadow zone PKIKP: average P velocity of the Earth P wave shadow zone PcP: average P velocity in the mantle From Shearer (1999)
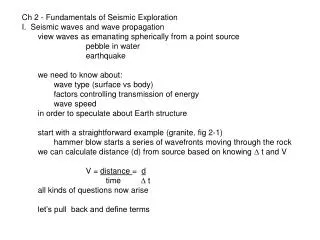
Ideal: Develop a good understanding of seismic wave propagation Greatly aided by improvements in: - data acquisition - computational power - computer visualization
Example: active source seismics Courtesy ExxonMobil
Examples: Global seismology • Alan Jones: Seismic Waves • Seismic phases, seismograms • www.geol.binghamton.edu/faculty/jones • Saadia Baker and Michael Wysession • Synthetic mantle shear waves, seismograms • Normal mode summation • http://epsc.wustl.edu/~saadia
4 0 3 23 7 17 12 1 Jones: seismic waves
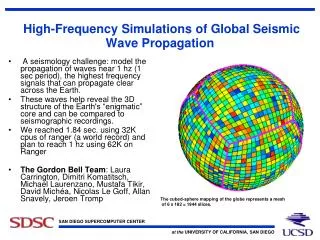
New approach: SPECFEM3D • Spectral finite element code (Komatitsch and Tromp, GJI, 2002; Komatitsch, Tromp and Ritsema, Science, 298, 2002 www.geoframework.org) • ‘Complete’ model: allows introduction of • Ellipticity, anisotropy • 3D mantle and crustal structure • Massively parallel computation • Linux PC clusters at Caltech, Michigan • Challenging code for visualization • Irregular grid • Massive amount of data: O(Terabyte)
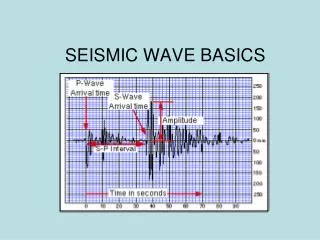
Quiz: Name the phases labeled A through F (white/red indicate positive amplitude only) P S
GS420 Fall 2002 3D = Geowall
EVL Volume Rendering 5123 8 bit 5123 16 bit • Use color and transparancy (Alternative: PC based volume renderer HVR www.lcse.umn.edu)
Quiz: Name the phases labeled A through F PPS PP Love ScSP ScSS PKP SK ScPP