Understanding Demographic Transition: Stages and Implications for Population Growth
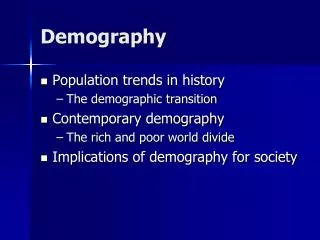
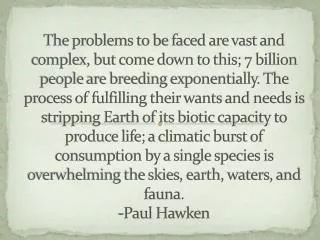
This overview explores the demographic transition, a process where populations shift from high birth and death rates to low rates, impacting growth dynamics. Early stages exhibit high mortality and fertility, leading to slow or stagnant growth. Subsequently, declining death rates spur population increases despite slower drops in fertility rates. Finland's progression through these stages illustrates this transition. The text also discusses challenges, such as the demographic trap evident in countries like Sudan, along with the epidemiologic transition and urbanization's effects.

Understanding Demographic Transition: Stages and Implications for Population Growth
E N D
Presentation Transcript
Demography - 3 MajSyedFawadMashhadi
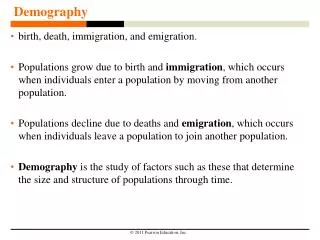
The Demographic Transition • Change that populations undergo from high rates of births and deaths to low rates of births and deaths • High levels of births and deaths kept most populations from growing rapidly throughout most of time • In fact, many populations not only failed to grow but also completely died out when births rates did not compensate for high death rates • Death rates eventually fell as living conditions and nutrition improved
The Demographic Transition…… • The decline in mortality usually precedes the decline in fertility, resulting in population growth during the transition period • Fertility rates fall neither as quickly nor as dramatically as death rates, and thus population grows rapidly
Finland is a good example of a country that has passed through the four stages of the demographic transition. Stage I High birth rate, high death rate= little or no growth (Finland in 1785 -1790) Birth rate: 38 per 1,000 Death rate; 32 per 1,000 Rate of natural increase: 0.6 percent
Stage II High birth rate, falling death rate = high growth (Finland in 1825 -1830) Birth rate: 38 per 1,000 Death rate: 24 per 1,000 Rate of natural increase:1.4 percent
Stage III Declining birth rate, relatively low death rate= slowed growth (Finland in 1910 -1915) Birth rate: 29 per 1,000 Death rate; 17 per 1,000 Rate of natural increase: 1.2 percent
Stage IV Low birth rate, low death rate= Very low population growth (Finland in 1996) Birth rate: 12 per 1,000 Death rate: 10 per 1,000 Rate of natural increase:0.2 percent
Beyond Transition • Fifth stage • Number of people is actually decreasing • When fertility falls to very low levels and stays there for a protracted period, a slow rate of population growth can turn into a negative one. • Many countries in Europe now have TFRs below the replacement level of about two children per woman. In the late 1990s, the TFRs of Bulgaria, Italy, Spain, the Czech Republic, Latvia, and Russia all were 1.2 among the world’s lowest.
Communicable & Non- Communicable Disease Comparison with Stages of Demographic Transition
Non-Communicable Diseases Communicable Disease
Replacement level Fertility • When a couple has 2 births during the reproductive life • Just enough to replace themselves. • At a community scale the replacement level is achieved when • TFR • 2.1 • NRR • 1
Population Momentum • Tendency of a population to continue to grow after replacement-level fertility has been achieved. • Total births continue to exceed total deaths as these youth become parents. • This large group becomes elderly and deaths increase to equal or outnumber births. • Thus it may take two or three generations (50-70 years) before each new birth is offset by a death in the population .
Improved quality of Health care Declining DR but BR is still high Demographic Trap - Stage 2 (Inc BR, Declining DR)
Demographic Trap – Example • Sudan (Failed State ?----- Classic Case) • It has developed far enough economically and socially to reduce mortality, • but not far enough to quickly reduce fertility • As a result, women on average have four children, double the two needed for replacement, and the population of 41 million is growing by over 2,000 per day • Under this pressure, Sudan—like scores of other countries—is breaking down.
Epidemiologic Transition • Pestilence (infections) & Famines • Infections & Nutritional Deficiencies • Receding Pandemics • Improved sanitation, Dec infections, Inc Diet (salt), inc Aging • Developing Countries • Degenerative & Man made Diseases • Inc aging, Lifestyles related to high SES, (diet, activity, addiction) • Countries in transition • Delayed degenerative & emerging infections • (Hybristics) • Reduced risk behaviors (Health promotion and prevention) • New treatments • Western countries
Delayed Degenerative & Emerging Infections Pestilence & Famines Receding Pandemics Degenerative & Man Made diseases High Stationary Early Expanding Late Expanding Low Stationary Declining
Urbanization and Distribution Urbanization is the increase population living in urban areas the process of people moving to cities or other densely settled areas.
Urban Countries differ in their definitions of urban, although it is fairly common for the urban population to consist of those living in towns and cities of 2,000 or more, especially if the population is largely nonagricultural. In densely populated Japan, the term “Urban” refers to areas with populations of 5,000 or more and with a population density of 1,544 or more per square Kilometer. In the United States, places with populations of 2,500 or more are considered urban.
Population density Population density is usually expressed as the number of people per unit of land area.
Push and pull factors • Migration can occur as result of push and / or pull factors. • Push factors • Force at person to migrate out of the area • Pull factors • Which encourage a person to migrate in that area
Push Factors • VALID UNDER NORMAL CONDITIONS • Head of the family moves • Transfer of job • Marriage • Business and economic deprivations • Absence of or poor educational facilities • Retirement and no re-employment • No housing shelter • Divorce • Fragmentation of agriculture land • Poor relationship with other members of the original community
Valid under abnormal conditions • War and fear or threat of war • Civil war and insecurity • Racial discrimination • Oppression • Cultural • Over crowding etc
Natural calamities • Earthquakes • Excessive rainfall and floods • Long persistent drought • Weather severity • Eruption of volcano • Severe and repeated cyclones • Epidemics etc
The pull factors are: • Employment • Economic benefits • Better educational facilities • Availability of better health facilities and medical treatment • Returning home • Peace and no fear on threat of war • Security • Racial harmony • Greater freedom
Better standard of living • No oppression • No culture • No earthquakes • Better climates • Hygiene • Fertile land
CENSUS • Process of collecting, compiling and publishing demographic, economic and social data pertaining to a specific time from all persons in a country.
METHODS • Enumerations • Pre-enumeration • Enumeration • Post-enumeration • Questionnaire • Combination of both
Types of Census DE- FACTO: A person is at the place he or she is found at the time of counting DE- JURE: A person is counted at the place of his or her actual residence
Information from Census • Population size • Urban-rural distribution • Marital status • Literacy/ educational attainment • Economic status • Occupation • Child population • Migration • Disability
Entertainment • What are the stages of Demographic transition? • What is meant by demographic trap? • What is census? Enumerate its types.